

 PIPAVO Team
Learn how order block trading works, identify valid zones, use BOS and CHoCH, calculate risk, and avoid common Forex mistakes.
In this article
An order block is a price zone traders associate with the origin of a strong market move. In practice, order block trading involves more than marking the last opposite-coloured candle: traders must evaluate structure, liquidity, displacement, invalidation, and risk before considering an entry.
Order blocks do not reveal institutional orders directly, and they do not guarantee that price will reverse. They are best treated as a structured price-action framework that must be objectively defined, tested, and combined with disciplined risk management.
What Is an Order Block in Forex Trading?
In Forex trading, an order block is usually defined as the final opposing candle—or a compact consolidation—before price makes a forceful move and breaks a relevant structural level.
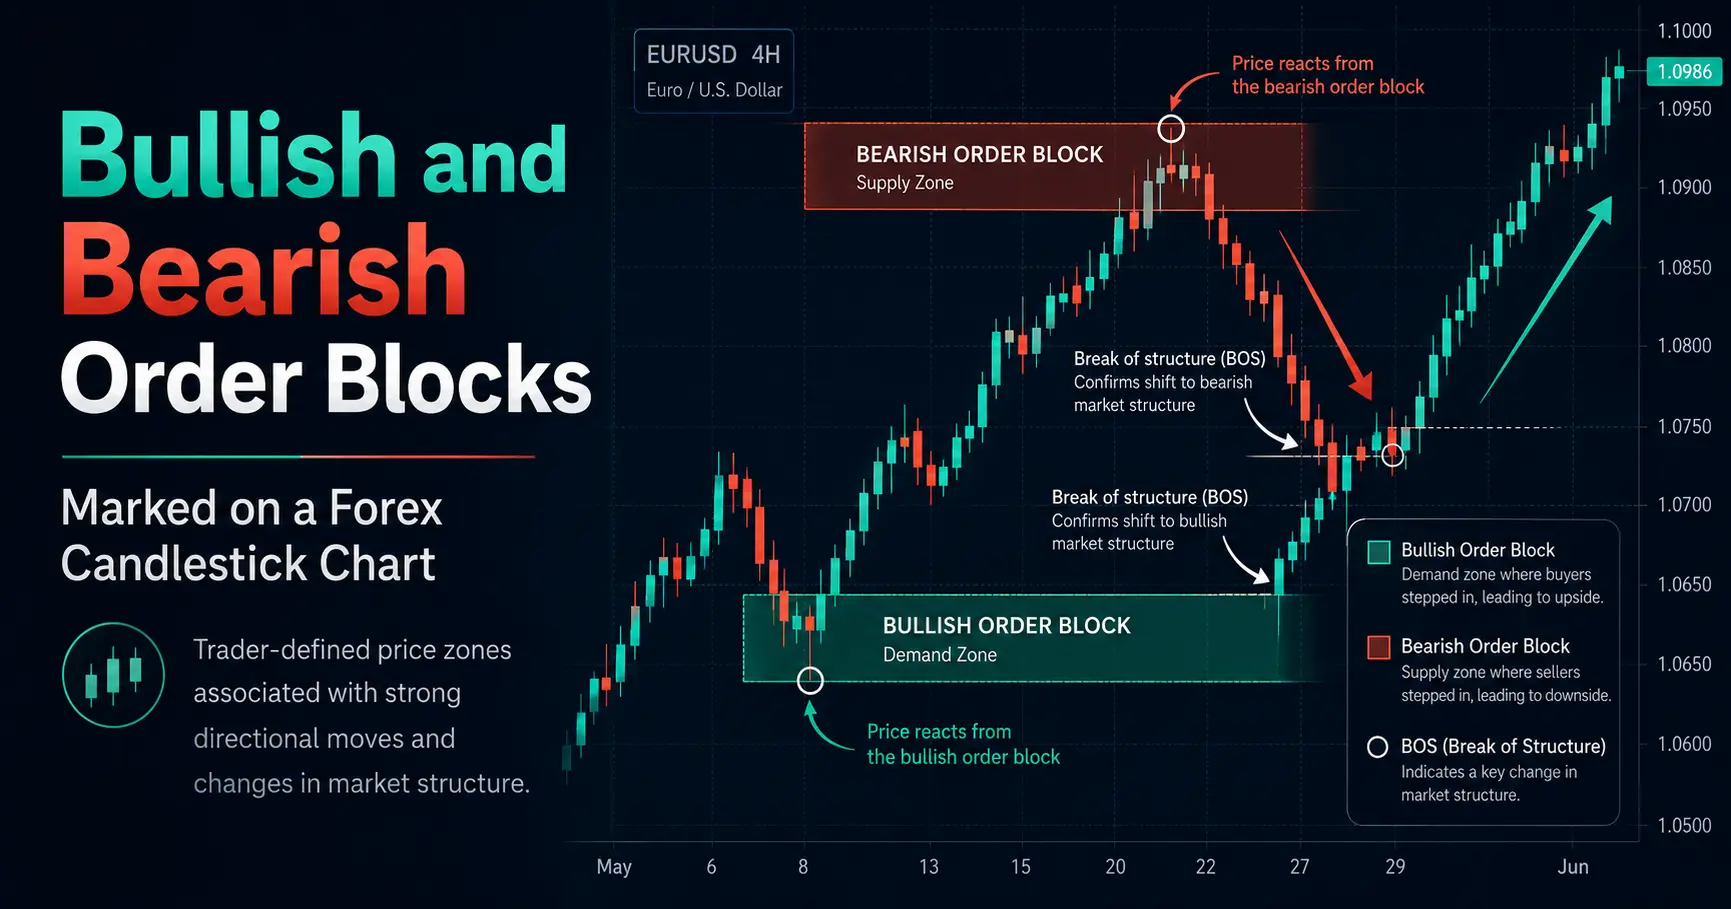
A bullish order block may form around the last bearish candle before a strong rally. A bearish order block may form around the last bullish candle before a sharp decline.
However, candle colour alone is not enough. A meaningful order block normally has several supporting features:
- Price leaves the area with visible momentum or displacement.
- The move breaks a relevant swing high or swing low.
- The zone has not already been repeatedly tested.
- There is enough space between the entry and the next opposing structure.
- The planned trade has a clearly defined invalidation level.
Does an order block prove institutional activity?
Order block theory is often explained as a method of locating areas where banks or other large institutions placed significant orders. That explanation should be treated carefully.
A standard retail candlestick chart does not show:
- Who placed a particular order
- The total size of an institution’s position
- Whether the same participant caused the next price move
- Whether unfilled institutional orders remain at the zone
- The complete global Forex order book
The foreign exchange market is decentralised and largely traded over the counter. The Bank for International Settlements reported average global FX turnover of $9.6 trillion per day in April 2025, based on data from more than 1,100 reporting dealers in 52 jurisdictions. This market includes spot transactions, forwards, swaps, options, and other instruments—not only the retail price chart displayed by a broker.
It is therefore more accurate to describe an order block as a trader-defined chart zone associated with a strong departure, rather than confirmed evidence of institutional accumulation or distribution.
Order blocks versus support and resistance
| Feature | Order block | Traditional support or resistance |
|---|---|---|
| Main basis | Origin of a strong directional move | Repeated historical reactions at a level |
| Structural break required | Usually expected | Not always |
| Displacement considered | Often important | May not be required |
| Typical shape | Candle or narrow zone | Horizontal level or broader area |
| Common entry method | Pullback into the zone | Bounce or breakout-retest |
| Main invalidation | Beyond zone or structural swing | Beyond support or resistance |
| Main limitation | Subjective candle and structure selection | Subjective level placement |
Neither concept is inherently superior. The practical value comes from whether the trader can define the rules consistently and test them over a meaningful sample.

Bullish and Bearish Order Blocks Explained
What is a bullish order block?
A bullish order block is a price zone associated with the final bearish candle or bearish consolidation before a strong upward move.
A higher-quality bullish setup commonly includes:
- A sweep of a previous low or other sell-side liquidity
- A forceful upward departure
- A break above a relevant swing high
- A return into the origin zone
- A stop level below a logically defined invalidation point
The nearest bearish candle before any rally is not automatically a bullish order block. The subsequent move should have structural significance.
What is a bearish order block?
A bearish order block is the final bullish candle or bullish consolidation before a strong downward move that breaks a relevant low.
A typical bearish setup may include:
- A sweep above an earlier high
- Strong downward displacement
- A break below a meaningful swing low
- A pullback into the origin area
- Invalidation above the block or structural high
Bullish versus bearish order blocks
| Element | Bullish order block | Bearish order block |
| Origin candle | Usually bearish | Usually bullish |
| Departure | Upward | Downward |
| Structural confirmation | Break above a relevant high | Break below a relevant low |
| Expected trade | Buy | Sell |
| Common stop area | Below block or swing low | Above block or swing high |
| Common target | Highs or buy-side liquidity | Lows or sell-side liquidity |
Hypothetical bullish example
Assume EUR/USD forms a bullish order block between 1.0820 and 1.0830 after sweeping a previous low and closing above a structural high at 1.0865.
A hypothetical trade plan could be:
- Entry: 1.0827
- Stop-loss: 1.0807
- Risk: 20 pips
- Target: 1.0887
- Potential reward: 60 pips
- Reward-to-risk ratio: 3:1
This example is hypothetical and excludes spread, commission, swap charges, and slippage.
Hypothetical bearish example
Assume GBP/USD forms a bearish block between 1.2710 and 1.2725 before breaking below a structural low at 1.2660.
A possible plan could be:
- Entry: 1.2715
- Stop-loss: 1.2735
- Risk: 20 pips
- Target: 1.2655
- Potential reward: 60 pips
- Reward-to-risk ratio: 3:1
A mathematically attractive ratio does not make either setup likely to succeed. The quality of the structure and the consistency of the execution rules still matter.

Market Structure You Need Before Trading Order Blocks
Order blocks are difficult to use consistently without a clear definition of market structure.
Swing highs and swing lows
A swing high is a local peak with lower highs or lower prices on both sides. A swing low is a local trough with higher lows or higher prices on both sides.
One simple rule is a five-candle fractal:
- A swing high has two lower highs before it and two lower highs after it.
- A swing low has two higher lows before it and two higher lows after it.
This is only one possible method. A trader may use another definition, but changing the definition after seeing the outcome introduces hindsight bias.
Major versus minor swings
Not every fluctuation has equal structural importance.
- Major swings define the broader range or trend.
- Minor swings form inside the larger movement.
- External structure refers to the broader structural boundaries.
- Internal structure refers to smaller movements inside those boundaries.
A five-minute bearish CHoCH can occur while the four-hour market remains bullish. Traders who ignore this distinction may repeatedly sell minor pullbacks within a larger uptrend.
Protected highs and protected lows
Some market-structure frameworks identify the swing that led to a confirmed structural break as protected.
In a bullish framework, the low that launched the move above a significant high may be treated as a protected low. The broader bullish structure remains intact unless that protected low is broken according to the trader’s selected rule.
The same principle applies in reverse to a protected high during a bearish trend.
Wick breaks versus candle-close breaks
| Rule | Wick break | Candle-close break |
| Sensitivity | Higher | Lower |
| Number of signals | More | Fewer |
| False-break exposure | Greater | Usually lower |
| Confirmation speed | Faster | Slower |
| Entry price | Potentially better | Potentially less favourable |
| Main weakness | Liquidity sweeps may be misclassified | Valid moves may be recognised late |
Neither method is universally correct. The important point is to choose one before testing.
Hypothetical structure case study
Suppose price:
- Forms a swing low at 1.0800.
- Rallies to 1.0860.
- Pulls back to 1.0820.
- Rallies and closes above 1.0860.
- Leaves behind a bearish candle between 1.0820 and 1.0830.
The close above 1.0860 may qualify as a bullish structural break. The bearish origin candle can then be assessed as a possible bullish order block.
If price later trades below the relevant protected low at 1.0800, the bullish premise may no longer be valid—even if part of the candle zone remains visually intact.

BOS and CHoCH: What Is the Difference?
What is a Break of Structure?
A Break of Structure, or BOS, is generally a break of a relevant swing point in the direction of the established trend.
In a bullish trend, a close above a previous significant high may be labelled a bullish BOS. In a bearish trend, a close below a relevant low may be labelled a bearish BOS.
BOS is commonly interpreted as continuation evidence. It is not a guarantee that continuation will occur.
What is a Change of Character?
A Change of Character, or CHoCH, is commonly defined as the first meaningful break against the existing structural sequence.
For example, during a pattern of higher highs and higher lows, a break below a relevant higher low may be called a bearish CHoCH.
It suggests that the prior trend may be weakening. It does not prove that a complete reversal has begun.
Why BOS and CHoCH definitions vary
Different traders may classify the same chart differently because they use different rules:
- Some require a candle-body close.
- Others count a wick.
- Some use only major external swings.
- Others use internal swings.
- Some call the first countertrend break CHoCH.
- Others call it a Market Structure Shift, or MSS.
- Some require displacement after the break.
- Others label the break before displacement is confirmed.
This variation is important. BOS and CHoCH are not standardised exchange definitions. They are analytical labels used within particular trading frameworks.
BOS versus CHoCH
| Feature | BOS | CHoCH |
| Typical direction | With prevailing structure | Against prevailing structure |
| Common interpretation | Possible continuation | Possible transition |
| Level broken | Prior trend-aligned swing | Countertrend structural swing |
| Confirmation strength | Depends on swing and close rule | Depends on swing and follow-through |
| Main risk | False continuation | Mistaking a retracement for reversal |
Trend-transition example
Assume a four-hour chart is making higher highs and higher lows. On the 15-minute chart, price breaks below a minor low.
That may qualify as a 15-minute bearish CHoCH, but it does not necessarily invalidate the four-hour uptrend. Price may simply be retracing into a four-hour bullish order block.
A stronger reversal case would require additional evidence, such as:
- A break below the four-hour protected low
- Strong bearish displacement
- Failure to reclaim the broken level
- Formation of lower highs and lower lows

The Role of Liquidity and Displacement
What does liquidity mean on a chart?
In practical chart analysis, liquidity refers to areas where traders believe orders may cluster.
Common examples include:
- Equal highs
- Equal lows
- Previous day highs and lows
- Session highs and lows
- Major swing points
- Obvious breakout levels
- Round-number prices
A trader might expect stop-loss orders above a visible high or below a visible low. However, the chart does not reveal the exact number, owner, or size of those orders.
Buy-side and sell-side liquidity
Buy-side liquidity is commonly described as a concentration of potential buy orders above highs. These may include buy-stop entries and stop-loss orders from short positions.
Sell-side liquidity refers to potential sell orders below lows, including sell-stop entries and stops from long positions.
A liquidity sweep occurs when price briefly trades beyond a visible level and then rejects it. A genuine breakout may instead close beyond the level and continue.
Liquidity sweep versus structural break
| Observation | Possible sweep | Possible structural break |
| Wick through level | Common | Possible but weaker evidence |
| Close beyond level | Not always | Often required |
| Immediate rejection | Frequent | Less consistent with continuation |
| Follow-through | Limited | Usually expected |
| Structural consequence | Level may remain relevant | Previous structure may be invalidated |
What is displacement?
Displacement is a strong directional move that shows urgency relative to surrounding price action.
It may include:
- Large candle bodies
- Limited overlap between candles
- Closes near candle extremes
- Rapid movement through a prior swing
- A visible imbalance between buying and selling pressure
There is no universal rule stating that displacement must equal a fixed number of pips or a specific multiple of average candle size. Traders should define measurable criteria during backtesting.
Liquidity-and-displacement checklist
Before marking an order block:
- Identify the relevant liquidity pool.
- Determine whether price swept or decisively broke it.
- Locate the swing level affected by the move.
- Evaluate the strength of the departure.
- Mark the origin candle or consolidation.
- Check whether the area has already been revisited.
- Confirm that sufficient target space remains.

How to Identify a High-Quality Order Block
A high-quality order block is not simply the cleanest-looking candle. It is a zone that satisfies a predefined set of contextual and risk criteria.
Step 1: Establish the higher-timeframe context
Start with a higher timeframe such as the daily, four-hour, or one-hour chart.
Determine whether price is:
- Trending higher
- Trending lower
- Moving within a range
- Approaching a major swing level
- Trading near a higher-timeframe supply or demand area
A bullish lower-timeframe block may be less attractive when price is directly below major higher-timeframe resistance.
Step 2: Identify the structural break
Write down exactly:
- Which swing was broken
- Whether the swing was internal or external
- Whether a wick or candle close is required
- Whether the break occurred with displacement
This prevents the trader from selecting a convenient swing after the trade has already worked.
Step 3: Assess displacement
Compare the departure with surrounding candles.
Useful questions include:
- Were the candle bodies meaningfully larger?
- Did price close through the swing?
- Was there limited overlap?
- Did the move quickly leave the origin area?
- Did price stall immediately after the break?
Weak, overlapping movement provides less convincing evidence than a decisive departure.
Step 4: Mark the origin
Depending on the rule set, the zone may include:
- The full high-to-low range
- The candle body
- The open to the candle low for a bullish block
- The open to the candle high for a bearish block
- A compact multi-candle consolidation
There is no universal boundary method. Test one method consistently before comparing alternatives.
Step 5: Check the liquidity context
A block may carry more contextual significance when the departure follows:
- A sweep of equal highs or lows
- A failed breakout
- A test of the previous day’s extreme
- A major session high or low
- A higher-timeframe swing interaction
A liquidity event does not guarantee that price will return to or react from the block.
Step 6: Check whether the zone is fresh
A fresh block has not been meaningfully revisited since the departure.
Possible classifications include:
- Untested
- Partially mitigated
- Fully mitigated
- Repeatedly tested
- Invalidated
Repeated visits may consume resting interest or simply show that the zone lacks decisive control. Either way, traders should not assume that each touch has equal quality.
Step 7: Assess the path to the target
Before entering, check:
- Distance to the nearest opposing block
- Distance to prior highs or lows
- Spread and expected execution costs
- Whether the target provides sufficient reward relative to risk
- Whether a major news event could affect execution
Practical quality scorecard
| Condition | Score |
| Higher-timeframe alignment | 1 |
| Clear liquidity event | 1 |
| Relevant structural break | 1 |
| Strong displacement | 1 |
| Fresh zone | 1 |
| Objective invalidation | 1 |
| Sufficient target space | 1 |
A zone scoring six or seven may meet stricter criteria than one scoring three. This scorecard is only a decision aid; it is not a scientifically validated forecasting model.
Weak or invalid examples
Avoid treating a candle as a high-quality block when:
- No relevant structure was broken.
- Price drifted away slowly.
- The zone sits in random mid-range consolidation.
- It has already been tested several times.
- The proposed entry is directly beneath resistance or above support.
- The zone became obvious only after the winning move was complete.

How to Draw an Order Block Correctly
Full-range method
The full-range method includes the entire candle from high to low.
Advantages:
- Greater chance of price touching the zone
- Includes the full candle structure
- Simpler to apply
Disadvantages:
- Wider stop
- Larger risk distance
- Less precise entry
Body-only method
This approach marks only the candle’s open-to-close body.
It produces a narrower area but increases the probability that price will reverse from the wick without filling the order.
Open-to-extreme method
A common refinement is:
- Bullish block: candle open to candle low
- Bearish block: candle open to candle high
This attempts to focus on the portion of the candle most relevant to the departure. It remains a framework convention rather than an objective market rule.
Midpoint method
Some traders use the 50% level of the order block.
For a block between 1.0800 and 1.0840:
[
text{Midpoint} = frac{1.0800 + 1.0840}{2} = 1.0820
]
The midpoint may improve the entry price, but price can react from the outer edge and never reach it.
Lower-timeframe refinement
A four-hour order block may contain a smaller 15-minute origin zone.
Refinement can reduce the stop distance, but excessive precision creates two risks:
- The trade may never fill.
- Normal volatility may trigger the stop before the expected move.
Zone-method comparison
| Method | Width | Fill probability | Stop distance | Missed-trade risk |
| Full range | Wide | Higher | Larger | Lower |
| Body only | Medium | Moderate | Moderate | Moderate |
| Open to extreme | Narrower | Moderate | Smaller | Higher |
| Midpoint | Single level | Lower | Potentially small | High |
| Lower-timeframe refinement | Very narrow | Variable | Smallest | Highest |
Refinement case study
Assume a GBP/USD origin candle has:
- Full range: 1.2700–1.2740
- Body range: 1.2712–1.2734
- Midpoint: 1.2720
- Lower-timeframe zone: 1.2715–1.2724
A trader using the full range may enter sooner but require a 45-pip stop. A trader using the refined area may risk only 20 pips but miss the move if price turns at 1.2730.
The “best” method depends on tested expectancy, not visual neatness.

Order Block Entry Strategies
Full-zone limit entry
A limit order is placed inside the block before price returns.
Advantages:
- No need to watch the chart continuously
- Potentially favourable entry
- Entry rules can be automated
Risks:
- No evidence of rejection is available at entry
- Price may trade directly through the block
- News or volatility may widen spreads
Midpoint entry
A trader places the order at the block’s 50% level.
This can improve the reward-to-risk ratio, but it may reduce the number of filled trades.
Lower-timeframe CHoCH entry
A confirmation-based entry may use this process:
- Price enters the higher-timeframe order block.
- Price sweeps a lower-timeframe high or low.
- Price breaks a countertrend swing.
- The trader marks the lower-timeframe origin.
- Entry occurs on a pullback.
- The stop is placed beyond the confirmed invalidation level.
This method adds evidence but normally produces a later and less favourable entry.
Rejection-candle entry
A pin bar, engulfing candle, or long wick may show rejection. However, a candlestick pattern alone does not establish market context.
A rejection candle is more useful when it appears:
- Inside a predefined block
- After a liquidity sweep
- With higher-timeframe alignment
- Near a clear invalidation point
Break-and-retest entry
Price may react from an order block, break a lower-timeframe structural level, and return to retest that level.
The trader enters after the retest rather than at the original block.
Entry-method comparison
| Entry | Confirmation | Price quality | Missed-trade risk | False-entry exposure |
| Full-zone limit | Low | High | Low | High |
| Midpoint limit | Low | Higher | High | High |
| Rejection candle | Moderate | Moderate | Moderate | Moderate |
| Lower-timeframe CHoCH | Higher | Lower | Higher | Lower |
| Break and retest | Higher | Lower | Higher | Lower |
Hypothetical comparison
Assume a bullish block spans 1.0810–1.0830, with invalidation at 1.0795 and a target at 1.0880.
Full-zone entry
- Entry: 1.0830
- Stop: 1.0795
- Risk: 35 pips
- Reward: 50 pips
- Ratio: approximately 1.43:1
Midpoint entry
- Entry: 1.0820
- Stop: 1.0795
- Risk: 25 pips
- Reward: 60 pips
- Ratio: 2.4:1
Confirmation entry
- Entry after bullish CHoCH: 1.0840
- Stop: 1.0815
- Risk: 25 pips
- Reward: 40 pips
- Ratio: 1.6:1
The midpoint offers the best theoretical ratio but may never fill. The confirmation entry offers more evidence but less remaining target space.

Where to Place the Stop-Loss
Beyond the order-block extreme
The simplest approach places the stop below a bullish block or above a bearish block.
This works only when crossing the block’s extreme genuinely invalidates the trade premise.
Beyond structural invalidation
Sometimes the relevant swing lies beyond the order block.
For example, a bullish block may end at 1.0810, but the protected low may be 1.0798. A stop at 1.0808 could be too close if the strategy requires the protected low to remain intact.
Volatility-adjusted stop
Average True Range, or ATR, measures recent price movement. Some traders add a fraction of ATR beyond the structural level to account for normal volatility.
ATR does not predict direction. A volatility buffer should be tested, not selected arbitrarily.
Spread and slippage
Retail Forex positions are executed using bid and ask prices. The visible chart price may not equal the exact stop-trigger or fill price.
Execution can be affected by:
- Wider spreads
- Low liquidity
- High-impact news
- Weekend gaps
- Broker execution policies
- Positive or negative slippage
Hypothetical stop comparison
Assume:
- Entry: 1.0825
- Order-block low: 1.0810
- Structural low: 1.0800
- Volatility-adjusted stop: 1.0796
| Stop method | Stop price | Distance |
| Block extreme | 1.0810 | 15 pips |
| Structural level | 1.0800 | 25 pips |
| Volatility-adjusted | 1.0796 | 29 pips |
With fixed monetary risk, a wider stop requires a smaller position.
Common stop-loss mistakes
- Placing the stop exactly where many traders can see the swing
- Widening the stop after entry
- Using the same stop distance on every pair
- Ignoring spread and slippage
- Choosing an unrealistically tight stop solely to display a high reward-to-risk ratio

How to Set Profit Targets
Opposing liquidity
Potential targets include:
- Previous swing highs
- Previous swing lows
- Equal highs or lows
- Previous session extremes
- Range boundaries
Opposing order blocks
A bullish trade may face resistance at a bearish order block. If the opposing zone is too close, the setup may not offer sufficient reward relative to risk.
Fixed reward-to-risk targets
Common examples include:
- 1R: potential reward equals initial risk
- 2R: potential reward equals twice initial risk
- 3R: potential reward equals three times initial risk
A 3R target is not automatically better than a 2R target. If the 3R level is beyond realistic structure, it may reduce the strategy’s win rate without improving expectancy.
Partial profit-taking
Assume:
- Entry: 1.0827
- Stop: 1.0807
- Risk: 20 pips
- Target one: 1.0867, equal to 2R
- Target two: 1.0887, equal to 3R
If 50% of the position closes at 2R and 50% at 3R:
[
(0.50 times 2R) + (0.50 times 3R) = 2.5R
]
The gross result is 2.5R before trading costs.
Moving the stop to break-even after the first target may reduce downside, but it may also close the remaining position during a normal retracement.

Position Sizing and Risk Management
Define monetary risk first
Do not begin with the maximum lot size permitted by the broker. Begin with the amount you are prepared to lose if the trade fails.
Examples of account risk might include 0.5%, 1%, or 2%, but no percentage is universally appropriate.
For a $10,000 account:
| Risk percentage | Maximum planned loss |
| 0.5% | $50 |
| 1% | $100 |
| 2% | $200 |
Position-size formula
A simplified calculation is:
[
text{Position size} =
frac{text{Monetary risk}}
{text{Stop distance in pips} times text{Pip value per lot}}
]
For many USD-denominated accounts trading EUR/USD, one standard lot has an approximate pip value of $10. The exact value depends on the pair, account currency, trade size, and exchange rate.
Worked example
Assume:
- Account balance: $10,000
- Risk: 1%
- Maximum planned loss: $100
- Stop distance: 25 pips
- Approximate pip value per standard lot: $10
[
text{Position size} =
frac{100}{25 times 10}
= 0.40 text{ standard lots}
]
Approximate outcomes before costs:
- Stop-loss: −$100
- 2R target: +$200
- 3R target: +$300
Slippage can cause the realised loss to exceed the planned amount.
Leverage is not the same as risk
Leverage determines how much market exposure a trader can control with available margin. It does not define a safe trade size.
A highly leveraged account can still risk only $100 on a trade if the position is sized correctly. Conversely, a trader can risk too much even with relatively low leverage by using a large position and no effective stop.
Regulatory examples as of July 2026
Retail leverage and margin protections vary by jurisdiction.
In the United Kingdom, the Financial Conduct Authority requires retail CFD leverage limits between 30:1 and 2:1, depending on the underlying asset. FCA rules also require account-level margin close-out when funds fall to 50% of the required margin and provide negative-balance protection for retail clients.
The European Securities and Markets Authority’s CFD framework specifies leverage limits of 30:1 for major currency pairs, 20:1 for non-major currency pairs, gold, and major indices, 10:1 for other commodities and non-major indices, 5:1 for individual equities and other reference values, and 2:1 for cryptocurrencies.
In the United States, NFA Financial Requirements Section 12—shown with an amendment effective March 18, 2026—requires a minimum security deposit of 2% of notional value for listed currencies and 5% for other transactions, subject to applicable adjustments and pair-specific requirements.
These are jurisdiction-specific examples, not universal rules. Traders should verify the latest requirements with their regulator and broker before opening an account.
Risk controls beyond one trade
A complete risk framework may also include:
- Maximum daily loss
- Maximum weekly drawdown
- Maximum number of simultaneous positions
- Limits on correlated exposure
- Restrictions around major news
- No widening of stops
- Mandatory breaks after repeated losses
Holding EUR/USD, GBP/USD, and AUD/USD positions in the same direction may create concentrated exposure to the US dollar even though they are separate trades.
[IMAGE 12 — position-sizing infographic | alt: Forex position-size calculation using account risk stop distance and pip value | caption: Position size should be calculated from the maximum acceptable loss rather than available leverage.]
A Complete Order Block Trading Strategy
The following framework is an educational example, not a proven or guaranteed system.
Market selection
Trade only when:
- The pair has acceptable spread and execution conditions.
- Price is moving clearly rather than fluctuating randomly.
- The relevant trading session is active.
- No immediate news event conflicts with the plan.
- The higher-timeframe structure can be defined objectively.
Multi-timeframe framework
A trader might use:
- Four-hour chart for directional context
- One-hour chart for the setup zone
- Five- or 15-minute chart for execution
No combination is universally best. The correct choice depends on the strategy’s tested results and the trader’s availability.
Setup rules
- Define the higher-timeframe trend or range.
- Mark major swing points and likely liquidity.
- Wait for price to interact with one of those areas.
- Require a sweep or structural break according to written rules.
- Require displacement.
- Mark the origin candle or consolidation.
- Check whether the block is fresh.
- Locate structural invalidation.
- Confirm sufficient room to the target.
- Calculate position size before placing the order.
Aggressive entry rules
- Place a limit order inside the block.
- Use the chosen full-range, midpoint, or refined boundary.
- Position the stop beyond predefined invalidation.
- Cancel the setup if structure changes before entry.
Conservative entry rules
- Wait for price to reach the block.
- Require a lower-timeframe liquidity sweep.
- Wait for CHoCH or BOS according to the selected framework.
- Enter on the retracement.
- Place the stop beyond the confirmation structure.
Exit rules
- Never widen the original stop.
- Take profit at predefined liquidity or structural levels.
- Use partial exits only if they are part of the tested plan.
- Exit early only when a written invalidation condition occurs.
- Record all trading costs.
Pre-trade checklist
| Question | Yes/No |
| Is higher-timeframe structure clear? | |
| Was relevant liquidity identified? | |
| Did a predefined BOS or CHoCH occur? | |
| Was displacement present? | |
| Is the block fresh? | |
| Is invalidation objective? | |
| Is target space sufficient? | |
| Is position size calculated? | |
| Are news and spread conditions acceptable? |

Worked Order Block Trade Example
The following case study is hypothetical and does not represent live market data.
Market context
Assume EUR/USD is in a four-hour uptrend.
- Previous structural high: 1.0870
- Sell-side liquidity: below 1.0800
- Price sweeps down to 1.0795
- Price then rallies and closes above 1.0870
The move above 1.0870 qualifies as bullish BOS under a candle-close framework.
Identifying the block
The final bearish candle before displacement has:
- Full range: 1.0805–1.0830
- Refined zone: 1.0815–1.0825
- Planned entry: 1.0822
- Structural stop: 1.0797
The stop distance is:
[
1.0822 - 1.0797 = 0.0025 = 25 text{ pips}
]
Calculating risk
Assume:
- Account: $20,000
- Risk: 0.5%
- Maximum loss: $100
- Stop: 25 pips
- Approximate EUR/USD pip value per standard lot: $10
[
text{Position size} =
frac{100}{25 times 10}
= 0.40 text{ lots}
]
Planning targets
- Target one: 1.0872
- Target two: 1.0897
From an entry at 1.0822:
- Target one distance: 50 pips, or 2R
- Target two distance: 75 pips, or 3R
Winning outcome
If the full position reaches target two:
- Approximate gross return: $300
- Result: +3R
If half closes at 2R and half at 3R:
- Approximate gross return: $250
- Result: +2.5R
Losing outcome
If price trades directly through the zone and triggers the stop:
- Planned loss: approximately $100
- Result: −1R
A losing result does not automatically mean the setup was identified incorrectly. No valid technical setup has a 100% win rate.
Missed-trade outcome
Price may touch 1.0828, reverse, and never reach the refined entry at 1.0822.
The trader misses the trade but preserves rule consistency. Moving the order after price has already turned may convert a planned trade into an emotional entry.
Lessons from the example
- Narrow refinement improves theoretical reward-to-risk but reduces fill probability.
- The stop must reflect invalidation, not desired position size.
- A valid setup can win, lose, or remain unfilled.
- Process quality should be evaluated separately from one trade’s outcome.

Order Blocks, Fair Value Gaps, and Supply and Demand
What is a fair value gap?
A fair value gap, or FVG, is a three-candle price imbalance used in some price-action frameworks.
In a bullish FVG, the high of the first candle is below the low of the third candle, leaving an area with limited candle overlap.
An FVG does not mean price is fundamentally “fair” or that price must return to fill the gap.
Order block versus fair value gap
An order block focuses on the origin candle or consolidation before a move. An FVG focuses on the imbalance created during the move.
They can overlap, but they are not the same chart feature.
Order block versus supply and demand
Supply and demand zones are typically broader areas where strong selling or buying previously occurred.
Order blocks tend to use more specific candle-based boundaries and frequently require a structural break.
Comparison
| Concept | Primary feature | Typical use | Main limitation |
| Order block | Origin of displacement | Pullback entry | Subjective origin selection |
| Fair value gap | Three-candle imbalance | Retracement area | Price may never fill it |
| Supply or demand | Broad reaction zone | Reversal or continuation | Often drawn too widely |
Combining the concepts
A trader may find:
- A bullish order block in the lower half of a range
- A bullish FVG overlapping the block
- A prior sweep of sell-side liquidity
- A bullish structural break
This creates confluence, but several labels describing the same move do not automatically create independent evidence.

Mitigation Blocks, Breaker Blocks, and Failed Order Blocks
What does mitigation mean?
Mitigation commonly refers to price returning to an order block after the initial departure.
Some traders interpret this as large participants managing earlier exposure or executing remaining orders. That explanation is a hypothesis, not something confirmed by the candle chart.
What is a mitigated order block?
A block may be classified as:
- Fresh: no return since formation
- Partially mitigated: price enters part of the zone
- Fully mitigated: price moves through most or all of it
- Invalidated: price breaks the technical or structural invalidation level
Traders disagree on whether a partially touched block remains valid. The rule should be written before testing.
What is a breaker block?
A breaker block is a failed order block that may later act as support or resistance in the opposite direction after a structural shift.
For example:
- A bullish order block forms.
- Price returns and closes below it.
- Bearish structure develops.
- Price retests the former block from below.
- The zone acts as resistance.
Failure alone is not enough. A trader may also require bearish displacement, a structural break, and a failed reclaim.

Common Order Block Trading Mistakes
| Mistake | Why it happens | Consequence | Correction |
| Marking every opposite candle | Oversimplified definition | Too many low-quality zones | Require structure and displacement |
| Ignoring higher timeframe | Focus on execution chart | Trading against broader context | Define external structure first |
| Treating CHoCH as guaranteed reversal | Misunderstanding transition signals | Premature countertrend trades | Require follow-through |
| Entering after extension | Fear of missing out | Poor target space | Wait for retracement |
| Over-refining | Desire for small stops | Missed trades and stop-outs | Test wider boundaries |
| Widening the stop | Avoidance of realised loss | Uncontrolled risk | Respect original invalidation |
| Excessive leverage | Focus on potential return | Rapid drawdown | Size from monetary risk |
| Hindsight backtesting | Rules selected after outcome | Inflated results | Use replay and fixed rules |
A common psychological trap is judging a setup entirely by the outcome. A rule-following loss can be a better trade than an impulsive winner.

How to Backtest an Order Block Strategy
Define every rule first
Before viewing the test sample, specify:
- Currency pairs
- Trading sessions
- Timeframes
- Swing definition
- BOS rule
- CHoCH rule
- Zone boundaries
- Entry trigger
- Stop placement
- Target method
- Maximum holding period
- News restrictions
Avoid future information
Use chart-replay software where candles are revealed sequentially.
Do not:
- Scroll forward before choosing the setup
- Move the zone after seeing the reaction
- Ignore setups that lose
- count only visually perfect examples
Include realistic costs
Record:
- Spread
- Commission
- Estimated slippage
- Overnight financing or swap
- Missed fills
- Partial fills where relevant
Metrics to track
Win rate
[
text{Win rate} =
frac{text{Winning trades}}{text{Total trades}}
]
Expectancy
(text{Loss rate} times text{Average loss})
]
Hypothetical expectancy example
Assume:
- Win rate: 42%
- Average win: 2.2R
- Loss rate: 58%
- Average loss: 1R
[
(0.42 times 2.2) - (0.58 times 1)
= 0.924 - 0.58
= 0.344R
]
The hypothetical expectancy is 0.344R per trade before costs.
If average trading costs equal 0.1R, net expectancy falls to approximately 0.244R.
Additional metrics
Track:
- Profit factor
- Maximum drawdown
- Average holding time
- Consecutive losses
- Maximum adverse excursion
- Maximum favourable excursion
- Performance by pair
- Performance by session
- Performance by market regime
Sample-size limitations
Ten or 20 attractive examples are not enough to establish a durable edge.
The test should include:
- Trending periods
- Ranging periods
- High volatility
- Low volatility
- Multiple sessions
- Different market months
- Both winning and losing sequences
There is no universal minimum sample size that guarantees statistical reliability. Larger samples generally provide more useful evidence, provided the strategy rules remain unchanged.
Backtesting journal
| Field | Record |
| Date | |
| Pair | |
| Session | |
| Higher timeframe | |
| Setup timeframe | |
| Liquidity event | |
| BOS/CHoCH rule | |
| Zone boundaries | |
| Entry | |
| Stop | |
| Target | |
| Risk in money | |
| Result in R | |
| Spread/slippage | |
| Rule violation | |
| Screenshot |

Are Order Blocks Reliable?
Order blocks can be useful as a structured way to define pullback zones and invalidation. Reliability does not come from the name of the setup.
It depends on:
- How swings are defined
- Whether BOS and CHoCH rules are consistent
- The selected timeframe
- Market conditions
- Entry method
- Stop placement
- Trading costs
- Position sizing
- Execution discipline
What order blocks can do
They can help traders:
- Standardise chart analysis
- Avoid chasing extended price
- Define potential entry zones
- Locate invalidation
- Build testable rules
What order blocks cannot do
They cannot:
- Prove institutional positioning
- Predict every reversal
- Eliminate losing trades
- Prevent slippage
- Guarantee positive expectancy
- Replace risk management
The CFTC warns that off-exchange retail Forex trading is highly risky and advises traders to research dealers carefully. Its consumer materials also warn against claims of unrealistic or guaranteed returns.
Before trading real money
Use this progression:
- Write objective rules.
- Backtest them on historical data.
- Forward-test in a demo account.
- Include realistic costs.
- Review performance by market condition.
- Start with small defined risk if moving to live trading.
- Stop or revise the strategy if live results materially diverge from testing.

Order Block Trading Checklist
Before marking the zone
- What is the higher-timeframe structure?
- Which swing is relevant?
- Where are the main liquidity areas?
- Did price produce meaningful displacement?
- Was structure broken by wick or close?
Before entering
- Is the zone fresh?
- Has the selected entry trigger occurred?
- Where is technical invalidation?
- Is the target structurally realistic?
- Is there enough reward after spread and commission?
- Is major news approaching?
Before placing the order
- What is the maximum monetary loss?
- What position size matches that risk?
- What conditions cancel the trade?
- Are correlated positions already open?
- Is the stop entered with the order?
After the trade
- Was the original plan followed?
- Were all costs recorded?
- What was the result in R?
- Was a screenshot saved?
- Did emotion change the execution?
- Does the trade belong in the strategy sample?

Frequently Asked Questions
An order block is a trader-defined price zone around the final opposing candle or short consolidation before a strong move that breaks relevant market structure. It does not prove that an institution placed orders there, and price is not guaranteed to react when it returns.
There is no universally best timeframe. A trader might use the four-hour chart for trend context, the one-hour chart to identify an order block, and the five- or 15-minute chart for entry confirmation. The combination should be selected through testing rather than personal preference alone.
That depends on the strategy’s rules. Some traders trade only fresh, untested zones. Others allow one partial mitigation. A zone that has been repeatedly tested or decisively broken may have lower relevance or be considered invalid.
The stop should be placed where the trade premise becomes invalid. That may be beyond the candle’s extreme, beyond a protected structural swing, or beyond the zone with a tested volatility allowance. Spread and slippage should also be considered.
An order block marks the origin candle or consolidation before a strong move. A fair value gap marks a three-candle imbalance created during the move. The two areas may overlap, but they describe different chart features.
Conclusion
Order block trading is most useful when treated as a complete analytical process rather than a candle-pattern shortcut.
A credible setup requires:
- Consistent swing definitions
- Clear BOS and CHoCH rules
- Higher-timeframe context
- Liquidity awareness
- Meaningful displacement
- Objective zone boundaries
- Structural invalidation
- Correct position sizing
- Realistic testing
The next practical step is to select one rule set, test it with sequential historical data, record all costs, and practise in a demo environment before risking capital.
No order block is guaranteed to hold. The goal is not to predict every market move, but to control risk while applying a repeatable process.
Financial Risk Disclaimer
This article is provided for general educational and informational purposes only. It does not constitute investment advice, personal financial advice, a trading recommendation, or an invitation to buy or sell any financial instrument.
Foreign exchange and CFD trading involve substantial risk. Leverage can magnify both gains and losses, and traders may lose some or all of their deposited capital. Stop-loss orders may not be filled at the requested price because of spreads, slippage, market gaps, liquidity conditions, or platform execution.
All price examples and trade scenarios in this article are hypothetical. They do not represent live market data, actual performance, or expected future results. Historical results, backtests, and hypothetical calculations do not guarantee future profitability.
Broker conditions, leverage limits, margin requirements, investor protections, and tax treatment differ by country and may change. Verify the latest information with the relevant regulator and an appropriately authorised broker. Consider obtaining independent financial, legal, or tax advice before trading.