

 PIPAVO Team
Learn how RSI, MACD, Bollinger Bands and Stochastic work in Forex, when to use each, how to combine them, and how to avoid false signals.
In this article
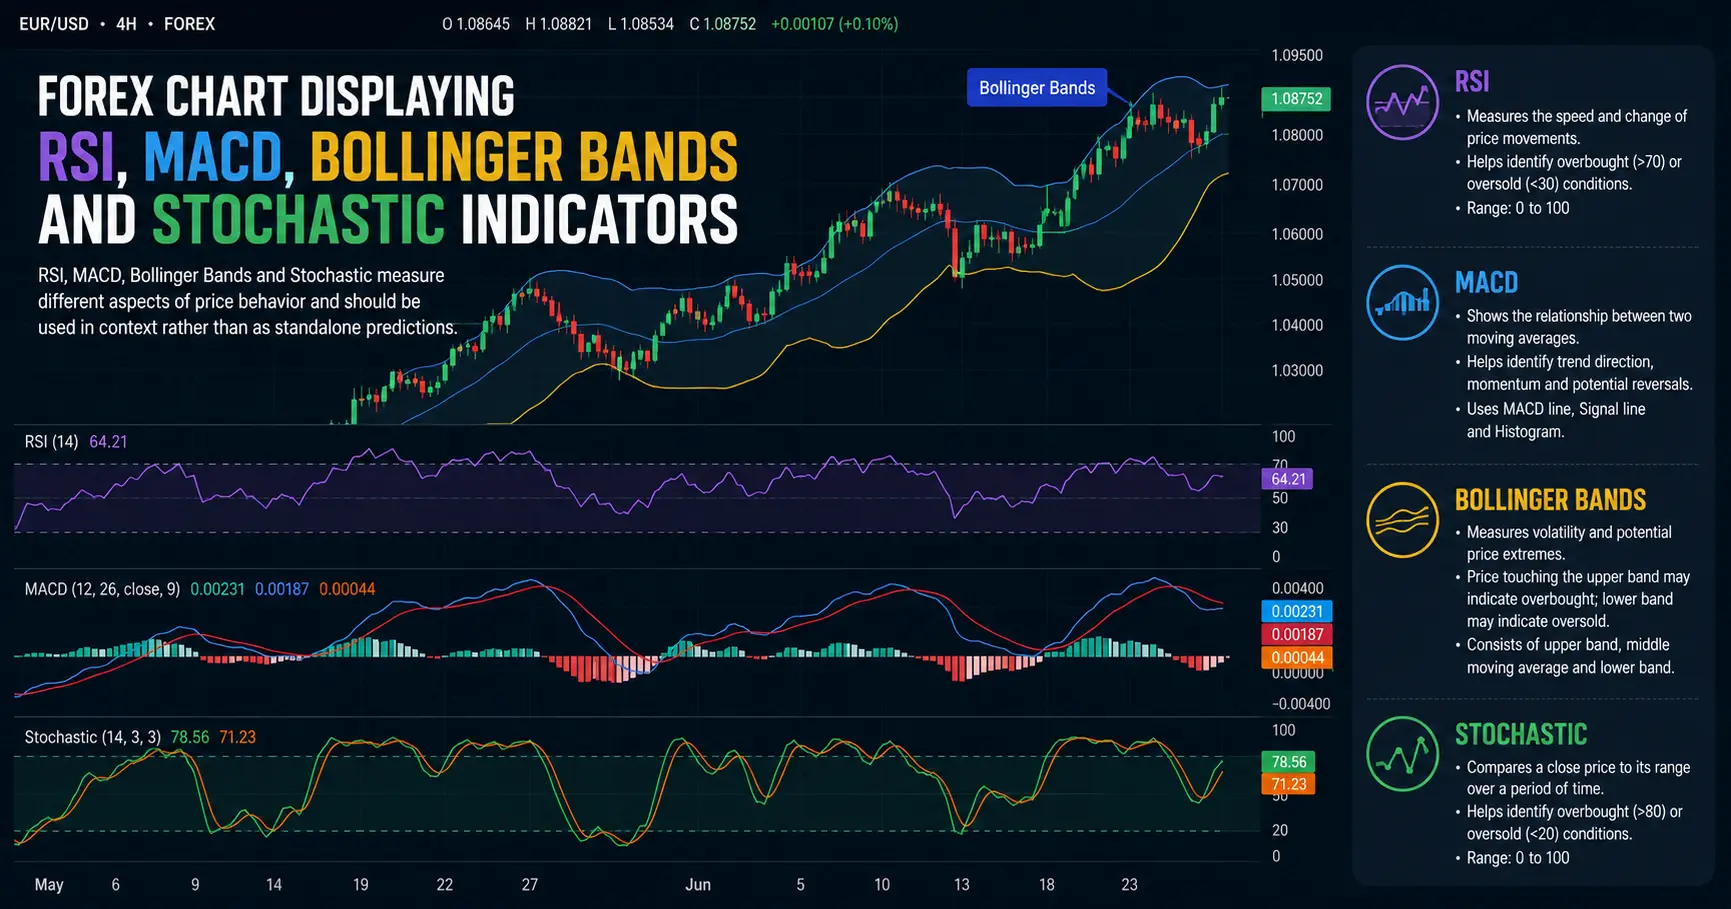
RSI, MACD, Bollinger Bands, and Stochastic are widely used Forex trading indicators, but they answer different questions: momentum, trend, volatility, and price location within a recent range. Rather than stacking them until several say “buy” or “sell,” traders should match each tool to the market regime and confirm signals with price structure. As of August 27, 2026, final BIS data put average OTC FX turnover in April 2025 at $9.510 trillion per day.
An earlier BIS preliminary release rounded the figure to $9.6 trillion per day, 28% above the 2022 survey. The detailed final dataset later reported $9.510 trillion, equivalent to approximately 27% growth. The final figure is used throughout this article.
What Are Forex Trading Indicators—and What Can They Actually Tell You?
Technical indicators transform historical price data into measurements that can make certain characteristics of the market easier to see. They do not know where the next candle will close.
A useful way to think about indicators is to ask what question the indicator is designed to answer.
| Indicator | Main Question | Primary Function | Often Most Useful When | Main Limitation |
|---|---|---|---|---|
| RSI | How strong is recent momentum? | Momentum oscillator | Evaluating momentum, pullbacks and divergences | Can remain overbought or oversold |
| MACD | Is trend momentum strengthening or weakening? | Trend/momentum | Directional markets | Repeated crossovers in ranges |
| Bollinger Bands | Is volatility expanding or contracting, and where is price relative to its recent average? | Volatility and relative price location | Ranges, squeezes and volatility expansion | A band touch is not automatically a reversal |
| Stochastic | Where did price close relative to its recent high-low range? | Momentum oscillator | Broad ranges and slower trends | Can remain extreme during strong trends |
Fidelity describes MACD as a momentum oscillator primarily used with trends and warns that it can repeatedly cross back and forth during trading ranges. Fidelity's Bollinger Bands guidance similarly states that the bands are not intended to be used alone.

Indicators Are Derived From Price, Not Independent Predictions
An RSI reading of 75 does not mean price must fall.
A MACD bullish crossover does not mean price must rise.
A touch of a lower Bollinger Band does not mean price has reached a bottom.
A Stochastic reading below 20 does not mean the market is objectively cheap.
These measurements describe what has already happened to price under a particular mathematical framework. Their usefulness comes from how they are combined with market structure, price location, volatility and risk management.
That distinction becomes especially important in Forex because the same indicator signal can mean something very different in a trend than in a sideways market.
RSI in Forex Trading: How to Read Momentum Correctly
The Relative Strength Index (RSI) is a bounded momentum oscillator developed by J. Welles Wilder. It moves between 0 and 100 and compares the magnitude of recent gains with recent losses.
A commonly used period is 14, and the traditional reference levels are:
- RSI above 70: conventionally described as overbought.
- RSI below 30: conventionally described as oversold.
Fidelity's current RSI material confirms the 0–100 range and the conventional 70/30 levels, while its charting documentation uses 14 periods as the standard setting.
How RSI Is Calculated
At a simplified level:
RS = Average Gain ÷ Average Loss
Then:
RSI = 100 − [100 ÷ (1 + RS)]
The calculation is subsequently smoothed as new price periods are added.
The important practical point is that RSI measures momentum, not fundamental value.
What RSI 70 and 30 Really Mean
One of the most common trading mistakes is interpreting:
RSI > 70 = sell
and
RSI < 30 = buy
That is too simplistic.
Fidelity explicitly notes that RSI may remain in overbought or oversold territory for extended periods—even weeks or months in some markets.
Suppose EUR/USD is advancing aggressively and RSI reaches 73. The reading tells you recent upside momentum has been strong relative to recent downside movement. It does not tell you that the next meaningful move must be downward.
A trader who automatically shorts every reading above 70 can repeatedly position against a strong trend.
RSI in a Trend vs a Range
Consider two different environments.
Scenario A: Directional uptrend
Price is making higher highs and higher lows. RSI reaches 72, falls to 52 during a pullback, then starts rising again.
The useful question may not be:
Is RSI overbought?
A better question is:
Is momentum reaccelerating in the direction of the existing trend after a controlled pullback?
Scenario B: Sideways range
Price repeatedly rejects the same support and resistance areas. RSI falls below 30 while price tests established support and then recovers.
In this environment, an RSI extreme may have more mean-reversion relevance because price is not displaying a persistent directional structure.
Market regime changes the interpretation.
RSI Divergence: Warning, Not Entry Signal
A bearish divergence occurs when price makes a higher high while RSI makes a lower high.
A bullish divergence occurs when price makes a lower low while RSI forms a higher low.
This means momentum is not confirming the new price extreme.
It does not mean reversal is guaranteed.
Divergence can persist while price continues trending. Treat it as evidence that momentum is changing—not as a complete trading system.

Worked RSI Forex Example
Hypothetical educational example—not live market data.
Assume:
- Account balance: $10,000
- Maximum risk: 1%
- Risk amount: $100
- EUR/USD is structurally bullish.
- A pullback forms a higher low.
- RSI falls from an elevated reading toward neutral territory and begins turning upward.
- Price then breaks a minor pullback high.
Hypothetical trade plan:
| Item | Value |
| Entry | 1.1050 |
| Stop-loss | 1.1025 |
| Stop distance | 25 pips |
| Target | 1.1100 |
| Target distance | 50 pips |
| Planned reward | 2:1 |
For this example, assume approximately $10 per pip per standard lot for EUR/USD.
To limit the planned loss to $100:
$100 ÷ 25 pips = $4 per pip
Approximate position:
$4 ÷ $10 = 0.40 standard lot
If the stop is reached, the planned loss is approximately $100 before slippage and other costs.
If the 50-pip target is reached, the gross hypothetical gain would be approximately $200 before costs.
Notice what RSI did not do: it did not determine the stop. The invalidation point came from price structure.
Common RSI Mistakes
| Mistake | Why It Is Weak | Better Approach |
| Short every reading above 70 | Strong trends can remain overbought | Check trend and structure first |
| Buy every reading below 30 | Oversold momentum can continue | Wait for evidence of stabilization |
| Trade divergence immediately | Divergence can persist | Require price confirmation |
| Continuously optimize RSI length | Encourages curve-fitting | Test settings on unseen data |
| Ignore timeframe | Different structures coexist across timeframes | Define the analysis timeframe before interpreting RSI |
MACD in Forex Trading: Trend, Momentum, and Crossovers
MACD—Moving Average Convergence/Divergence—measures the relationship between two exponential moving averages.
An exponential moving average (EMA) is a moving average that places greater weight on more recent observations.
The standard MACD configuration commonly uses:
- Fast EMA: 12 periods
- Slow EMA: 26 periods
- Signal line: 9-period EMA of MACD
Fidelity's Technical Indicator Guide defines the MACD line as the 12-period EMA minus the 26-period EMA and the signal line as a 9-period EMA of MACD.
MACD Line, Signal Line, Histogram and Zero Line
The indicator typically includes:
MACD line
MACD = EMA(12) − EMA(26)
Signal line
A 9-period EMA of the MACD line.
Histogram
The difference between MACD and its signal line.
Zero line
The level where the fast and slow moving averages are equal.

What a MACD Crossover Means
A bullish crossover occurs when the MACD line crosses above the signal line.
A bearish crossover occurs when it crosses below.
But a crossover is only one piece of information.
Fidelity specifically warns that MACD can whipsaw during trading ranges, with the faster line repeatedly crossing the signal line.
That is why the same bullish crossover can be much more meaningful after an orderly pullback in an established uptrend than in the middle of a narrow sideways range.
Why the Zero Line Matters
Consider two bullish crossovers:
Crossover A: MACD crosses upward while deeply below zero.
This may indicate that bearish momentum is weakening and upside momentum is recovering.
Crossover B: MACD crosses upward above zero while an uptrend remains structurally intact.
This may instead represent trend continuation.
Neither interpretation is guaranteed. The zero line simply adds context about the relationship between the fast and slow EMAs.
MACD Divergence
Like RSI, MACD can diverge from price.
If price creates a new high while MACD forms a lower high, upside momentum may be weakening.
Again, weakening momentum and an actual reversal are different events.
Worked MACD Trend-Continuation Scenario
Hypothetical educational example—not live market data.
Assume GBP/USD has:
- Formed a series of higher highs and higher lows.
- Pulled back without breaking the most recent major higher low.
- Seen MACD contract toward the zero line.
- Produced a fresh bullish MACD crossover.
- Broken above the local pullback structure.
Trade example:
| Item | Value |
| Account balance | $20,000 |
| Risk percentage | 0.5% |
| Maximum planned risk | $100 |
| Entry | 1.2700 |
| Stop | 1.2660 |
| Stop distance | 40 pips |
| Target | 1.2780 |
| Target distance | 80 pips |
| Planned R | 1:2 |
Assuming approximately $10 per pip per standard lot:
$100 ÷ 40 = $2.50 per pip
Approximate size:
0.25 standard lot
The important sequence is:
structure first → pullback → momentum confirmation → entry → structural invalidation
not:
MACD crossed → immediately enter
Common MACD Mistakes
- Trading every signal-line crossover.
- Ignoring sideways conditions.
- Treating the histogram as a price forecast.
- Assuming a shrinking histogram guarantees a reversal.
- Entering after price has already moved so far that sensible reward-to-risk no longer exists.
Bollinger Bands in Forex: Volatility, Compression, and Expansion
Bollinger Bands place an upper and lower envelope around a moving average.
A widely used configuration is:
- Middle band: 20-period simple moving average
- Upper band: 2 standard deviations above the average
- Lower band: 2 standard deviations below the average
Fidelity lists 20 periods and two standard deviations as the default configuration.
A standard deviation measures how dispersed observations are around their average. In practical chart terms, Bollinger Bands widen as measured volatility rises and narrow as volatility declines.
A Band Touch Is Not Automatically a Reversal
Fidelity's guidance notes that price can exceed or hug a band for prolonged periods during strong trends.
Therefore:
Upper Band ≠ automatically overvalued enough to short
Lower Band ≠ automatically undervalued enough to buy
If price repeatedly rides the upper band while making higher highs and higher lows, selling simply because it touched the band can mean repeatedly fading strong momentum.
The Bollinger Band Squeeze
When the bands contract, recent volatility has declined.
This is commonly called a Bollinger Band squeeze.
The squeeze tells you:
Volatility has compressed.
It does not tell you:
The breakout will be upward.
Fidelity's current guide notes that tighter bands during low volatility may precede a sharp move in either direction and also warns about false moves.

Mean Reversion vs Breakout Trading
These are two very different uses of Bollinger Bands.
| Mean-Reversion Approach | Breakout Approach | |
| Desired regime | Established range | Compression before expansion |
| Price location | Near outer band and range boundary | Near consolidation boundary |
| Confirmation | Rejection back toward range | Structural break and follow-through |
| Typical invalidation | Beyond range extreme | Back through failed breakout structure |
| Main risk | Trend begins and price walks band | False breakout |
Using one strategy's logic in the other environment is a common source of poor signals.
Hypothetical Bollinger Squeeze Example
Assume GBP/USD has traded between 1.2980 and 1.3020 for several hours while the Bollinger Bands steadily contract.
Price then:
- Closes above 1.3020.
- Bollinger Bands begin widening.
- Price holds above the former resistance area on a retest.
Hypothetical plan:
- Entry: 1.3030
- Stop: 1.3000
- Risk: 30 pips
- Target: 1.3090
- Potential reward: 60 pips
- Planned R:R: 1:2
The signal is not simply that price crossed an upper Bollinger Band.
The thesis is:
compression → break of established structure → volatility expansion → successful hold above the breakout area
A candle immediately returning into the old range would weaken the setup.
Stochastic Oscillator in Forex: Reading Momentum Inside a Range
The Stochastic Oscillator compares the latest closing price with the market's recent high-low range.
It moves between 0 and 100.
Fidelity describes Stochastic as a momentum indicator and notes that it is most effective in broad trading ranges or slower-moving trends.
%K and %D
The faster line is generally called %K.
A simplified fast-Stochastic calculation is:
%K = 100 × [(Close − Lowest Low) ÷ (Highest High − Lowest Low)]
Fidelity's standard example uses a 14-period lookback. A common %D line is a 3-period moving average of %K.
For Slow Stochastic, additional smoothing is applied to %K. Fidelity's guide describes a %K slowing period of 3. This leads to the commonly used slow configuration often expressed as 14,3,3.
What 80 and 20 Mean
Common reference areas are:
- Above 80: overbought region
- Below 20: oversold region
Fidelity uses these thresholds in its current Fast and Slow Stochastic guides.
But the terminology can be misleading.
A Stochastic value above 80 primarily tells you that price is closing toward the upper end of its recent high-low range. It does not establish that the currency pair is economically “too expensive.”
Why Stochastic Often Fits Ranges Better Than Strong Trends
Imagine a clearly defined range between support at 0.6580 and resistance at 0.6680.
If price approaches 0.6680 while Stochastic is above 80 and then turns lower, the oscillator is occurring at a location where mean-reversion logic may already make sense.
Now imagine a strong breakout trend.
Stochastic reaches 90, falls to 78, then rises to 95 while price keeps advancing.
Repeatedly shorting because the reading is high means fighting directional momentum.

Hypothetical Stochastic Range Trade
Assume AUD/USD is ranging between 0.6580 support and 0.6660 resistance.
Price tests 0.6580 and rejects it.
Stochastic:
- moves below 20,
- %K turns upward,
- %K crosses %D,
- price then closes back above a local rejection candle.
Hypothetical plan:
| Item | Value |
| Entry | 0.6600 |
| Stop | 0.6575 |
| Risk | 25 pips |
| Target | 0.6650 |
| Reward | 50 pips |
| Planned R | 1:2 |
On a $10,000 account risking $100 and assuming approximately $10 per pip per standard lot, the hypothetical position size would be about 0.40 lot.
If price instead closes decisively below the range support, the original mean-reversion thesis has changed. The oscillator remaining “oversold” is not a reason to keep buying.
RSI vs MACD vs Bollinger Bands vs Stochastic: Which Should You Use?
There is no universally best Forex indicator because the tools measure different features of price.
A more useful question is:
Which indicator best answers the question I have about this market?
| Market Question | Most Relevant Tool |
| Is recent momentum strengthening or weakening? | RSI |
| Is trend momentum changing relative to two EMAs? | MACD |
| Is volatility compressed or expanding? | Bollinger Bands |
| Is price closing near the top or bottom of its recent range? | Stochastic |

A Practical Market-Condition Matrix
| Market Condition | Primary Tool to Consider | Secondary Context | Be Especially Careful With |
| Strong directional trend | MACD | RSI and swing structure | Countertrend Stochastic extremes |
| Trend pullback | RSI | MACD and structure | Treating overbought as sell |
| Defined sideways range | Stochastic | Bollinger Bands and boundaries | MACD crossover noise |
| Low-volatility compression | Bollinger Bands | Consolidation structure | Predicting direction from squeeze alone |
| Possible momentum failure | RSI or MACD divergence | Structure | Divergence as immediate entry |
RSI vs Stochastic: Avoid Double-Counting Momentum
RSI and Stochastic are mathematically different, but both are momentum oscillators.
If both display an oversold condition, that does not necessarily mean you have two fully independent pieces of evidence.
A cleaner confluence model might combine:
- price structure for direction,
- Bollinger Bands for volatility,
- and RSI for momentum.
That provides more varied information than using several oscillators that react to similar changes in price.
Choose the Market Regime Before Choosing the Indicator
Before asking what RSI, MACD or Stochastic says, decide whether price is:
- Trending.
- Ranging.
- Transitioning between the two.

How to Identify a Trend
A basic price-structure definition is:
Uptrend
Higher high → higher low → higher high → higher low.
Downtrend
Lower low → lower high → lower low → lower high.
The structure does not have to be visually perfect. What matters is whether meaningful swing points continue to progress directionally.
How to Identify a Range
Signs of a range include:
- repeated rejection from similar highs,
- repeated support around similar lows,
- overlapping swings,
- repeated failed attempts to extend directionally.
A range gives Stochastic and mean-reversion Bollinger Band signals a different context from a directional trend.
How to Recognize a Transition
A transition may begin when several conditions appear together:
- the trend fails to extend,
- a meaningful protected swing breaks,
- volatility changes,
- momentum diverges,
- price begins forming the opposite sequence of swings.
No individual condition guarantees that a new trend has started.
Five-Step Market-Regime Checklist
1. Mark major swings.
Do not begin with the indicator panel.
2. Classify the higher-timeframe sequence.
Higher highs/higher lows, lower highs/lower lows, or no clear directional sequence.
3. Mark obvious range boundaries and prior structural levels.
4. Observe volatility.
Are Bollinger Bands contracting, stable or expanding?
5. Select the indicator according to the regime.
This process avoids trying to make one indicator work in every environment.
How to Combine Indicators Without Creating False Confluence
Confluence means several relevant pieces of evidence support the same trading thesis.
It does not mean:
Four indicators are green, therefore the trade is four times stronger.

Weak Confluence
Example:
- RSI oversold.
- Stochastic oversold.
- another momentum oscillator oversold.
Three indicators may essentially be telling you that recent downside momentum has been unusually strong.
Better-Diversified Confluence
Example:
Structure: Higher-timeframe uptrend remains intact.
Location: Price has pulled back into prior support.
Volatility: Bollinger Bands are no longer aggressively expanding downward.
Momentum: RSI begins recovering.
Trigger: Price breaks the pullback structure.
Invalidation: A close below the structural low would undermine the setup.
Now each component has a clearer job.
A Three-Layer Framework
A relatively clean technical framework can be organized as:
Layer 1 — Context
What is market structure doing?
Layer 2 — Condition
What do volatility and momentum say?
Layer 3 — Execution
Where does the thesis become invalid, and does the remaining target justify the risk?
Adding more indicators is useful only if they add new information.
CHoCH vs BOS: How Market Structure Can Confirm Indicator Signals
BOS and CHoCH are common terms in Smart Money Concepts and related price-action frameworks.
They should be used carefully because there is no single universal rulebook governing which swing counts, whether a wick is sufficient, or whether internal and external structure should be treated identically.
Recent 2026 educational sources broadly agree on the directional distinction while differing in exact confirmation methodology. FXOpen describes BOS as a continuation break and CHoCH as a countertrend structural break, while other frameworks explicitly require defined swing-selection and confirmation rules before either label is applied.

What Is a Break of Structure?
Under a common structure framework:
In an uptrend:
HH → HL → break above HH = bullish BOS
In a downtrend:
LL → LH → break below LL = bearish BOS
A BOS therefore describes price continuing to break a relevant swing in the direction of the prevailing structure. Current 2026 Forex educational material commonly uses this continuation definition.
What Is a CHoCH?
A Change of Character (CHoCH) generally refers to the first meaningful break against the previous structural sequence.
Example in an uptrend:
- higher high,
- higher low,
- new higher high,
- then price breaks below the relevant higher low.
That break may be labeled bearish CHoCH.
It warns that bullish structure has been violated.
It does not prove a new bearish trend is established. Recent 2026 descriptions similarly characterize CHoCH as a potential-reversal warning rather than certain reversal confirmation.
Why Traders Can Label the Same Chart Differently
Suppose a 15-minute chart contains several small swing lows inside a four-hour uptrend.
One trader may classify a break of a minor 15-minute low as CHoCH.
Another may call it only internal structure and wait for the larger four-hour swing to break.
Neither label is useful unless the trader defines:
- timeframe,
- eligible swing size,
- wick versus close rule,
- internal versus external structure,
- confirmation requirement.
ChartMini's 2026 methodology article makes this point explicitly: structure labels depend on predefined swing eligibility, timeframe, trigger and confirmation rules.
Wick, Close or Liquidity Sweep?
Some frameworks require a candle close beyond structure.
Others recognize a wick break.
A wick above a previous high followed by an immediate close back below may be called a liquidity sweep in some trading frameworks.
That label should describe observable price behavior, not be treated as proof that a specific institution intentionally “hunted stops.”
The practical question is simpler:
Did price accept beyond the prior level, or did the breakout fail?
RSI Divergence + CHoCH Case Study
Hypothetical educational example.
EUR/USD structure:
- Swing high: 1.0800
- Higher low: 1.0750
- New higher high: 1.0830
At 1.0800, RSI peaked at 74.
At the new 1.0830 high, RSI reaches only 68.
That produces bearish RSI divergence.
At this point:
What has changed? Momentum.
What has not necessarily changed? Trend structure.
Now suppose EUR/USD closes below 1.0750.
Under a close-based framework where 1.0750 is the relevant protected higher low, this may be classified as bearish CHoCH.
The trader now has:
- weakening momentum,
- structural violation,
- a potential transition.
Still, reversal is not guaranteed.
Two Possible Outcomes
Scenario A — Reversal develops
Price:
- closes below 1.0750,
- retests the broken zone,
- forms a lower high,
- then breaks a new low.
The sequence is beginning to establish bearish structure.
Scenario B — CHoCH fails
Price:
- briefly breaks or closes below 1.0750,
- immediately reclaims it,
- rises through 1.0830,
- extends the original uptrend.
Under the same framework, the renewed break above the prior high may represent bullish BOS.
That is why neither CHoCH nor BOS should be treated as certainty.
A Step-by-Step Forex Indicator Trading Framework
The goal is to turn indicator information into a repeatable decision process.

Step 1: Read the Higher-Timeframe Structure
Before looking for an entry, establish whether the broader market is:
- bullish,
- bearish,
- ranging,
- or unclear.
If structure is unclear, “no trade” is also a valid analytical conclusion.
Step 2: Identify the Market Regime
Ask:
- Trend?
- Range?
- Compression?
- Transition?
Step 3: Select the Indicator for the Question
Momentum: RSI
Trend/momentum relationship: MACD
Volatility: Bollinger Bands
Range-relative momentum: Stochastic
Step 4: Define Price Location
A signal occurring at a meaningful location is generally more informative than an identical signal appearing in the middle of nowhere.
Relevant locations might include:
- prior swing,
- established range boundary,
- consolidation edge,
- previous support or resistance,
- pullback area.
Step 5: Define the Trigger
Examples:
- local structure break,
- rejection candle,
- momentum recovery,
- breakout and retest,
- volatility expansion.
Step 6: Define Invalidation Before Entry
Ask:
What price action would demonstrate that my original thesis is no longer valid?
That level should guide stop placement.
Step 7: Calculate Position Size
Suppose:
- Account = $10,000
- Risk = 1%
Risk amount = $10,000 × 0.01 = $100
If the stop is 25 pips:
Maximum risk per pip = $100 ÷ 25 = $4
Position size must then be adjusted so the pip value is approximately $4.
Step 8: Assess Reward-to-Risk
If:
- Stop = 25 pips
- Target = 50 pips
then:
Reward-to-risk = 50 ÷ 25 = 2
or 2:1.
A 2:1 ratio does not automatically make a trade good. The probability of reaching the target, trading costs and strategy expectancy still matter.
Step 9: Record the Trade
Record at minimum:
- pair,
- timeframe,
- regime,
- structure,
- indicator condition,
- entry,
- stop,
- target,
- planned risk,
- actual result,
- whether rules were followed.
A trading journal is valuable not because it eliminates losses but because it allows rules to be evaluated over a sample rather than from memory.
How Indicator Settings Change Signal Quality
Standard indicator settings are conventions—not universal optimums.
| Indicator | Common Configuration |
| RSI | 14 periods |
| MACD | 12, 26, 9 |
| Bollinger Bands | 20 periods, 2 standard deviations |
| Slow Stochastic | Commonly 14,3,3 |
These conventions are documented in Fidelity's indicator resources.

Shorter Settings
A shorter lookback generally causes the indicator to react more rapidly to new price information.
Potential benefit:
- earlier response.
Potential cost:
- more fluctuation,
- more signals,
- potentially more false triggers.
Longer Settings
A longer lookback generally smooths more price data.
Potential benefit:
- reduced sensitivity to small movements.
Potential cost:
- greater lag,
- later signals.
Fidelity notes the same general sensitivity trade-off in its indicator documentation: shorter periods increase sensitivity while longer averaging introduces more smoothing and lag.
Should You Change RSI 14?
Possibly—but not because the last three trades lost.
For example:
- RSI 7 will react more quickly than RSI 14.
- RSI 21 will generally react more slowly.
A change should be based on a tested strategy hypothesis.
Should You Change MACD 12,26,9?
Changing the fast and slow EMA periods changes how quickly MACD responds to price.
Faster settings may help shorter-horizon analysis but usually produce more fluctuations.
Slower settings may reduce noise at the cost of delayed signals.
Should You Change Bollinger Bands 20,2?
Changing the lookback alters the average and volatility sample.
Changing the standard-deviation multiplier alters the width of the envelope.
For example, increasing the deviation multiplier generally moves the bands farther from the average, reducing how frequently price interacts with them.
The Curve-Fitting Problem
Imagine testing hundreds of indicator combinations until one produces an exceptional historical equity curve.
You may have discovered a robust relationship.
Or you may simply have discovered the parameter set that best fits historical noise.
This is curve-fitting or overfitting.
The remedy is not to avoid optimization entirely. It is to validate the chosen rules on data that were not used to develop them.
How to Backtest RSI, MACD, Bollinger Bands, and Stochastic Properly
A few attractive historical chart screenshots do not establish that a trading system has an edge.
A meaningful backtest requires explicit rules.

Define the Rules Before Testing
A test should specify:
- currency pair,
- timeframe,
- indicator settings,
- entry condition,
- stop rule,
- target or exit rule,
- spread,
- commission where applicable,
- slippage assumptions,
- position-sizing method,
- trading hours,
- news exclusions if used.
Without fixed rules, the trader can unconsciously reinterpret past signals to make the strategy look better than it really was.
In-Sample vs Out-of-Sample
In-sample data is used to develop or optimize the strategy.
Out-of-sample data is unseen data used to test whether the strategy still behaves acceptably after development.
If you optimize RSI settings on the entire historical dataset and then call that same dataset a “backtest,” you have not performed a clean independent validation.
Forward Testing
A strategy that survives historical validation can next be tested on:
- a demo environment,
- simulated execution,
- or tightly controlled live exposure appropriate to the trader's circumstances.
Forward testing introduces elements historical charts may not reproduce perfectly, including actual spread changes, latency, slippage and trader behavior.
Win Rate Alone Is Not Enough
Consider two hypothetical systems.
| Metric | System A | System B |
| Win rate | 65% | 45% |
| Average win | 0.8R | 2R |
| Average loss | 1R | 1R |
| Loss rate | 35% | 55% |
A simple expectancy formula is:
Expectancy = (Win Rate × Average Win) − (Loss Rate × Average Loss)
System A:
(0.65 × 0.8R) − (0.35 × 1R)
= 0.52R − 0.35R
= +0.17R per trade
System B:
(0.45 × 2R) − (0.55 × 1R)
= 0.90R − 0.55R
= +0.35R per trade
Despite having a lower win rate, hypothetical System B has the higher expectancy.
This is why claims such as “indicator X wins 70% of the time” are not sufficient to evaluate a trading strategy.
Risk Management Matters More Than the Indicator
An indicator can influence entry timing.
It cannot decide how much of your account you lose when a trade fails.

Risk Per Trade Example
Assume a $10,000 account and a chosen maximum risk of 1%, or $100, for a hypothetical EUR/USD trade.
Assuming approximately $10 per pip per standard lot:
| Stop Distance | Maximum $/Pip | Approximate Position |
| 20 pips | $5.00 | 0.50 lot |
| 40 pips | $2.50 | 0.25 lot |
| 80 pips | $1.25 | 0.125 lot |
The wider stop does not require accepting four times as much account risk.
The position can be reduced.
Structure-Based vs Arbitrary Stops
Suppose your technical thesis is invalid only if EUR/USD breaks 40 pips below your entry.
Placing a 10-pip stop simply because you want a larger reward-to-risk ratio does not necessarily improve the trade. It may place the stop inside normal market noise while leaving the original thesis intact.
A better sequence is:
- Define invalidation.
- Calculate stop distance.
- Adjust position size.
- Evaluate whether the available target still justifies the risk.
Leverage Amplifies Outcomes
The CFTC warns that OTC Forex trading uses margin and that leverage magnifies both gains and losses. Its current customer advisory also notes that, under the U.S. OTC retail structure it discusses, traders can potentially lose their margin and may in some circumstances be responsible for additional losses.
Protections and rules differ by broker, product and jurisdiction. Traders should therefore verify the terms that apply to their own account rather than assuming one country's protections or leverage rules apply globally.
Trading Costs Matter
A strategy that targets only a small number of pips is especially sensitive to:
- spread,
- commission,
- financing,
- slippage.
Those costs must be included in testing.
A hypothetical strategy that earns 2 pips before costs but incurs 1.5 pips of effective execution cost has a very different profile from one earning 2 pips net.
Common Indicator Trading Mistakes—and How to Fix Them

| Mistake | What Goes Wrong | Corrective Action |
| 1. Sell every RSI >70 | Strong trend may continue | Evaluate trend and structure |
| 2. Buy every RSI <30 | Weakness can persist | Wait for stabilization or confirmation |
| 3. Trade every MACD crossover | Ranges create whipsaws | Filter by market regime |
| 4. Fade every Bollinger Band touch | Price can walk the band | Check trend and volatility |
| 5. Trade every Stochastic extreme | Extreme readings can persist | Use range boundaries and price confirmation |
| 6. Stack similar oscillators | Creates false confluence | Combine different information categories |
| 7. Ignore higher timeframe | Lower-timeframe signal may oppose larger structure | Establish top-down context |
| 8. Change settings after losses | Encourages curve-fitting | Evaluate a statistically meaningful sample |
| 9. Enter before defining invalidation | Position size becomes arbitrary | Define stop before sizing |
| 10. Treat CHoCH/BOS as certainty | Structural breaks can fail | Use predefined rules and contingency plans |
The shared lesson is straightforward:
A technical indicator is useful only when its job, market context and invalidation criteria are clearly defined.
Which Forex Indicator Is Best for Beginners?
A beginner does not need four indicators on the chart.
A cleaner learning path is to understand price structure first and then add one indicator at a time.

A Practical Learning Sequence
1. Price structure
Learn:
- highs,
- lows,
- trends,
- ranges,
- support/resistance,
- invalidation.
2. RSI
Learn momentum and why overbought/oversold does not automatically mean reversal.
3. Bollinger Bands
Learn volatility compression, expansion and relative price location.
4. MACD
Learn the relationship between trend and momentum.
5. Stochastic
Learn range-relative momentum.
6. Confluence
Only then ask whether combining tools adds independent information.
When Should You Add a Second Indicator?
Add another indicator when it answers a question your existing framework does not answer.
For example:
“RSI already measures momentum. I need a way to visualize volatility.”
Adding Bollinger Bands makes conceptual sense.
By contrast:
“RSI says momentum is weak. I want two more momentum indicators to confirm that momentum is weak.”
That may only make the chart more complicated without adding much new information.
Frequently Asked Questions
Neither is universally better. RSI is primarily a momentum oscillator bounded between 0 and 100, while MACD measures the relationship between shorter and longer exponential moving averages. RSI can be useful for evaluating momentum and divergences; MACD is often more useful for analyzing trend momentum. The better choice depends on the market regime and strategy.
The conventional setting is 14 periods, with 70 and 30 commonly used as overbought and oversold reference levels. Fidelity documents these standard settings but also notes that RSI can remain beyond the traditional levels during strong trends. There is no universal best setting for every pair or timeframe. Alternative periods should be tested rather than assumed to be superior.
A common MACD configuration is 12,26,9: 12-period EMA, 26-period EMA, 9-period signal EMA. Fidelity identifies this as the default MACD calculation in its Technical Indicator Guide.
Yes, but both are momentum oscillators, so they may provide partially overlapping information. Two bullish oscillator readings should not automatically be treated as two independent confirmations. A cleaner system may combine one momentum oscillator with price structure or a volatility tool.
They can be used on short timeframes, but Bollinger Bands do not remove the challenges of short-term trading. Spread, commission, slippage and price noise become increasingly important when profit targets are small. A band touch alone is not sufficient evidence for a reversal; Fidelity notes that price can remain near or beyond a band during strong trends.
Conclusion: Use Indicators as Evidence, Not Answers
RSI, MACD, Bollinger Bands and Stochastic can all improve Forex chart analysis when each tool is given a clearly defined job.
RSI helps evaluate momentum.
MACD helps analyze trend-momentum relationships.
Bollinger Bands help visualize relative price location and volatility compression or expansion.
Stochastic measures where the close sits within a recent high-low range.
None of them can determine the future with certainty.
A stronger trading process is:
market structure → regime → price location → appropriate indicator → confirmation → invalidation → position size → execution → review
Before risking real capital, convert the idea into explicit rules and test those rules across sufficient historical and forward samples. If the strategy only works when its rules are changed after every losing trade, the problem is unlikely to be the indicator setting.
Financial Risk Disclaimer
This article is provided for educational and informational purposes only and does not constitute investment advice, trading advice, a recommendation, solicitation or guarantee of future results.
Forex and other leveraged products involve substantial risk. Leverage can magnify both gains and losses, and regulatory protections, margin requirements, negative-balance protections, execution practices and product structures differ by jurisdiction and provider. The CFTC warns that margin-based OTC Forex trading can produce rapid losses and that traders should understand the risks and dealer relationship before participating.
All price levels, entries, stops, targets, account balances, position sizes and strategy examples in this article are hypothetical educational examples rather than live market data or trade recommendations. Actual results may differ because of spread, commission, financing, slippage, liquidity, execution and market conditions.
Past performance, historical backtests and indicator signals do not guarantee future results. Readers should verify the latest rules and account conditions applicable to their broker and jurisdiction and, where appropriate, seek independent professional financial advice.