

 PIPAVO Team
Learn Forex risk management with sizing formulas, stop-loss examples, leverage rules, drawdown controls, and a practical checklist.
In this article
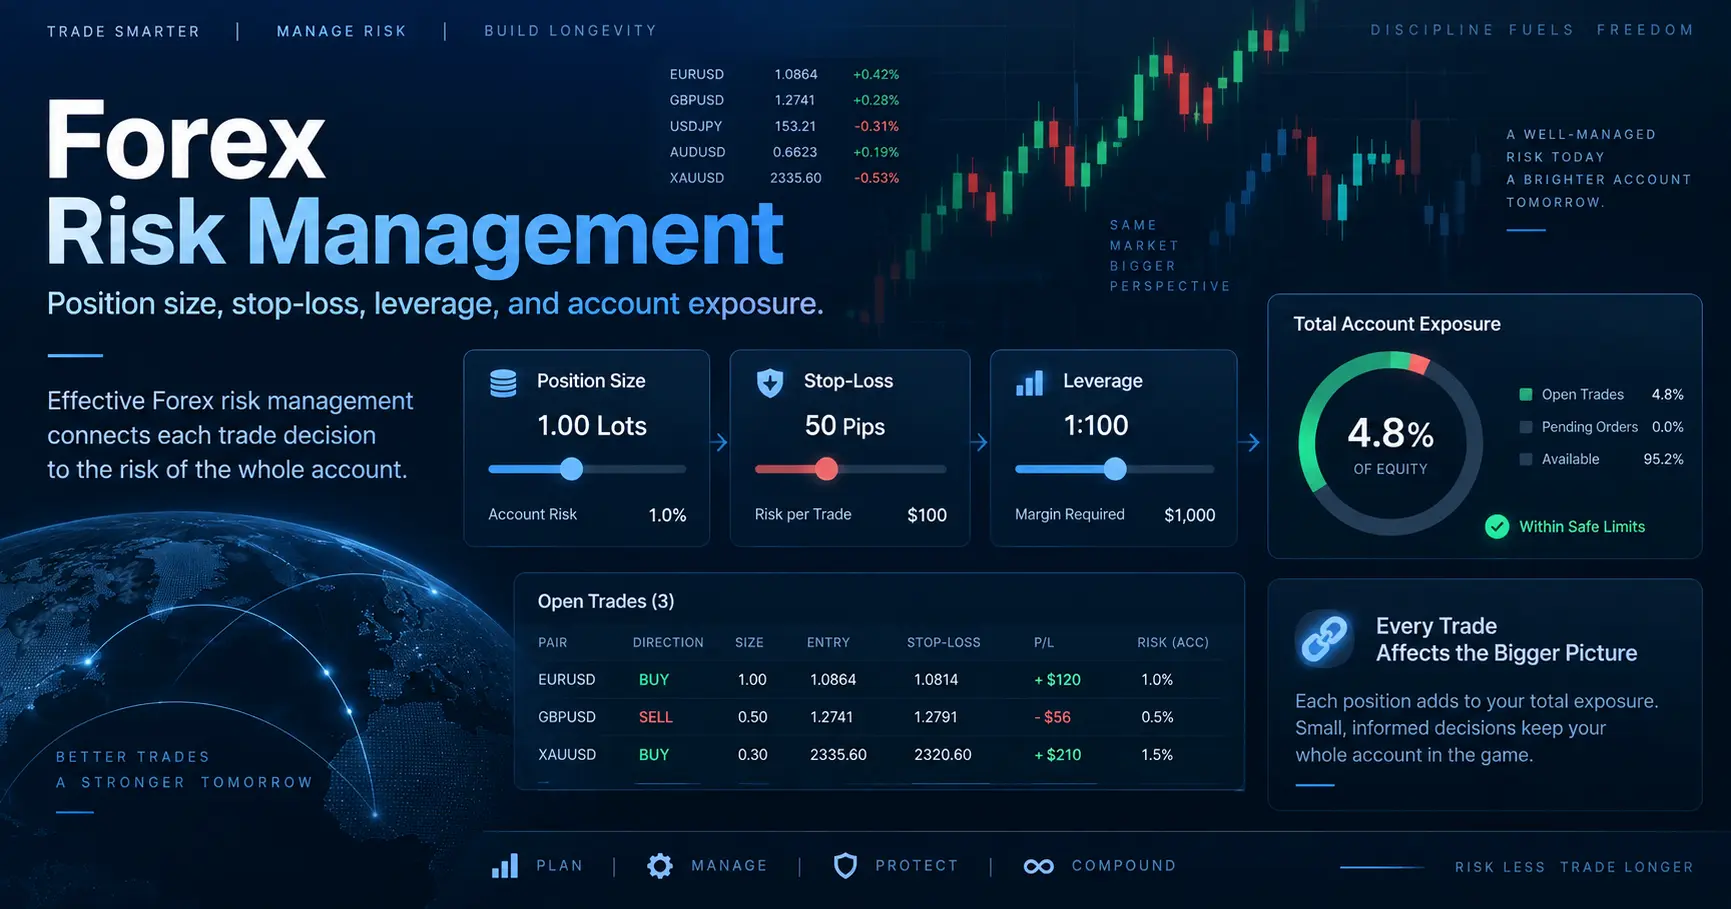
Forex risk management is the process of deciding how much you can lose before entering a trade, then aligning your stop-loss, position size, leverage, and total exposure with that limit. It cannot prevent every loss or turn an unprofitable strategy into a profitable one. Its purpose is to keep losses controlled enough for you to evaluate and execute a trading method without one position or losing sequence destroying the account.
What Is Forex Risk Management?
Forex risk management is a set of rules for identifying, measuring, and limiting financial loss. It operates at three connected levels:
| Level | Main question | Typical controls |
|---|---|---|
| Trade | How much can this position lose? | Stop-loss, cash-risk limit, position size |
| Account | How much can all open positions lose? | Total-risk cap, margin limit, daily loss limit |
| Portfolio | Are several trades exposed to the same event? | Currency caps, correlation review, stress testing |
Suppose two traders both buy EUR/USD with a stop 25 pips below their entries. Trader A chooses a position size calculated to lose approximately $100 at the stop. Trader B selects the largest size permitted by available margin.
They share an entry and stop, but they do not have the same risk plan. Trader A has defined the account impact. Trader B has allowed leverage and broker margin to determine it.
A planned loss can also differ from the realised loss. Spread, commission, slippage, gaps, financing, and order-execution rules can push the final result beyond the entry-to-stop calculation.
Risk controls cannot create a trading edge. If a method loses $0.10 on average for every $1 risked, smaller positions only make that negative expectancy unfold more slowly. The benefit is that controlled sizing creates time and usable data with which to identify the problem.

Why Risk Management Matters in Forex
The latest comprehensive Bank for International Settlements survey found that global foreign-exchange turnover averaged $9.6 trillion per day in April 2025, 28% above its 2022 level. The US dollar was on one side of 89% of transactions. FX swaps accounted for about $4 trillion per day, while spot trading represented 31% of turnover, according to the BIS 2025 Triennial Central Bank Survey.
A later BIS analysis reports $9.5 trillion and 27% growth, apparently reflecting later benchmarking or rounding. Both refer to April 2025; this article uses the headline survey figure while acknowledging the discrepancy. See the BIS Quarterly Review, December 2025.
Large turnover does not mean every currency pair is equally liquid at every hour or price. Liquidity can deteriorate around economic announcements, market openings, holidays, or unexpected events.
Leverage makes those changes more consequential. Consider a hypothetical $10,000 account using its full balance as margin:
| Effective leverage | Notional exposure | Loss from a 1% adverse move | Account loss |
|---|---|---|---|
| 5:1 | $50,000 | $500 | 5% |
| 20:1 | $200,000 | $2,000 | 20% |
| 50:1 | $500,000 | $5,000 | 50% |
This simplified example excludes costs and protective orders. It illustrates why available buying power should not be treated as an appropriate position size.
The CFTC states that approximately two out of three customers at registered US retail Forex dealers lose money each quarter. Results vary by dealer and reporting period, so this is neither a universal global statistic nor a forecast for a particular trader. It is nevertheless a strong warning against treating leveraged currency trading as easy income. See the CFTC Forex Frauds advisory and its 2022 retail Forex customer advisory.

Know the Risks You Are Managing
“Market risk” is only one part of Forex risk. A workable plan addresses how a loss can occur as well as how large that loss is intended to be.
| Risk | How it arises | Possible control |
|---|---|---|
| Market risk | The exchange rate moves against the position | Technical invalidation and stop-loss |
| Volatility risk | Normal price movement becomes unusually wide | Smaller size, volatility-adjusted stop |
| Leverage risk | Large notional exposure magnifies small movements | Effective-leverage limit |
| Margin risk | Equity becomes insufficient to support positions | Free-margin buffer and total-exposure cap |
| Liquidity risk | Fewer executable prices are available | Avoid thin periods or reduce size |
| Spread risk | Bid–ask spread widens | Include spread in pre-trade risk |
| Slippage risk | Execution occurs beyond the expected price | Slippage allowance; guaranteed stop if available |
| Gap risk | Price jumps across the stop | Reduce or close exposure before known gaps |
| Rollover risk | Overnight financing changes the trade result | Check the broker’s swap schedule and rates |
| Counterparty risk | A dealer or intermediary fails or acts improperly | Use an appropriately regulated firm |
| Operational risk | Platform, connection, or device fails | Backup access and broker contact procedure |
| Behavioural risk | Fear, greed, or revenge trading overrides rules | Hard loss limits and a documented process |
Retail spot Forex is commonly traded over the counter rather than through one central exchange. The CFTC warns US customers that, in off-exchange retail Forex, the dealer is the customer’s counterparty and controls the trading platform. Traders should verify a firm’s registration, legal entity, complaint history, custody arrangements, and withdrawal conditions—not only its spreads or leverage.

How Much Should You Risk per Trade?
The frequently quoted “1% rule” means limiting the planned loss on one trade to 1% of account equity. It is a policy choice, not a law or a promise of safety.
Calculate cash risk as:
Cash risk = Account equity × Risk percentage
For a hypothetical $10,000 account:
- At 0.25%, cash risk is $25.
- At 0.50%, cash risk is $50.
- At 1.00%, cash risk is $100.
- At 2.00%, cash risk is $200.
The appropriate ceiling depends on the capital you can afford to lose, strategy evidence, frequency, simultaneous positions, execution risk, and tolerable drawdown. A new or incompletely tested strategy may justify less risk than an extensively tested one—but testing still cannot guarantee future performance.
Fixed-percentage sizing reduces the cash amount risked as equity falls:
| Risk per trade | Balance after 5 consecutive losses | Drawdown | Balance after 10 | Drawdown |
|---|---|---|---|---|
| 0.25% | $9,875.62 | 1.24% | $9,752.79 | 2.47% |
| 0.50% | $9,752.49 | 2.48% | $9,511.10 | 4.89% |
| 1.00% | $9,509.90 | 4.90% | $9,043.82 | 9.56% |
| 2.00% | $9,039.21 | 9.61% | $8,170.73 | 18.29% |
These figures assume every loss equals exactly the planned amount, with no gaps or extra costs. Real results can be worse.
A trader should also define aggregate risk. If the per-trade limit is 1% but four positions can simultaneously lose 1%, the account has 4% planned open risk. If those positions express the same currency view, effective concentration may be greater than the trade count suggests.

How to Calculate Forex Position Size
Position sizing should follow this sequence:
- Identify where the trade idea becomes invalid.
- Measure the distance from entry to that level.
- Set the maximum cash risk.
- calculate pip value in the account currency.
- Add expected costs or an execution allowance.
- Calculate the position.
- Round down to a permitted increment.
The basic formula is:
Position size in lots = Cash risk ÷ (Adjusted stop distance × Pip value per standard lot)
Example 1: USD account trading EUR/USD
All prices are hypothetical.
- Account equity: $10,000
- Risk limit: 1%, or $100
- Long entry: 1.1050
- Stop: 1.1025
- Chart distance: 25 pips
- Spread allowance: 1.0 pip
- Commission equivalent: 0.7 pip
- Slippage allowance: 0.8 pip
- Adjusted distance: 27.5 pips
- Approximate pip value per standard lot: $10
Position size = $100 ÷ (27.5 × $10) = 0.3636 lots
If the broker accepts 0.01-lot increments, round down to 0.36 lots, or 36,000 currency units. Adjusted planned risk is approximately:
27.5 × $10 × 0.36 = $99
Ignoring costs would produce a 0.40-lot position. That position risks $100 over the chart distance alone, leaving no allowance for spread, commission, or slippage.
Example 2: USD account trading USD/JPY
Hypothetical USD/JPY price: 150.00. For one standard lot:
JPY pip value = 100,000 × 0.01 = ¥1,000
Convert to dollars:
¥1,000 ÷ 150.00 = approximately $6.67 per pip
With $50 cash risk and a 30-pip adjusted stop:
$50 ÷ (30 × $6.67) = approximately 0.25 lots
Pip value changes as the exchange rate changes, so recalculate rather than permanently assuming one value.
Example 3: GBP account trading EUR/USD
Assume:
- Cash risk: £75
- Adjusted stop: 20 pips
- EUR/USD pip value: $10 per standard lot
- Hypothetical GBP/USD conversion rate: 1.2500
Convert the pip value:
$10 ÷ 1.2500 = £8 per pip
Then:
£75 ÷ (20 × £8) = 0.46875 lots
Rounded down to 0.46 lots, the adjusted planned loss is approximately £73.60.
| Lot label | Currency units | EUR/USD pip value in a USD account* |
|---|---|---|
| Standard | 100,000 | $10.00 |
| Mini | 10,000 | $1.00 |
| Micro | 1,000 | $0.10 |
| Nano | 100 | $0.01 |
*For a conventional 0.0001 pip and excluding broker-specific contract differences.

How to Place a Stop-Loss Logically
A stop should sit where the reason for holding the trade is no longer valid. It should not be moved closer merely to make a desired lot size fit.
Common methods include:
| Method | Basis | Strength | Limitation |
|---|---|---|---|
| Structure-based | Swing high, swing low, or invalidation level | Connects risk to the trade thesis | Structure can be subjective |
| Volatility-based | Average True Range or observed range | Adapts to changing movement | Indicator settings are backward-looking |
| Time-based | Exit if movement does not occur by a deadline | Limits stagnant exposure | Price may move after the exit |
| Event-based | Exit before a defined announcement | Reduces scheduled event risk | May sacrifice a valid longer-term position |
| Fixed-distance | Same pip distance each trade | Simple and consistent | Ignores structure and volatility |
Consider a hypothetical long setup with a $100 risk limit. The nearest defensible invalidation is 40 pips below entry, but the trader initially wants a 20-pip stop to trade 0.50 lots.
At $5 per pip, 0.50 lots over 20 pips risks $100. But if the market can fluctuate normally through that level, the stop has been chosen to fit the size rather than the analysis.
Using the 40-pip technical stop requires:
$100 ÷ (40 × $10 per standard lot) = 0.25 lots
The stop is twice as wide, but the cash risk remains $100 because the position is halved.
A normal stop does not guarantee the fill price. A stop is typically triggered and then executed at an available market price. The SEC’s investor bulletin on stop orders explains this general execution distinction. Exact Forex handling varies by dealer, so check the broker’s order policy.

Using Market Structure Without Treating It as Certainty
Market structure describes how price forms swing highs and lows. In a simplified framework:
- An uptrend forms higher highs and higher lows.
- A downtrend forms lower lows and lower highs.
- A range lacks a sustained directional sequence.
Two frequently used labels are Break of Structure (BOS) and Change of Character (CHoCH). Their definitions are not standardised across all trading communities.
A common interpretation is:
| Term | Typical interpretation | Risk-management use |
|---|---|---|
| BOS | A break in the direction of the established structure | Possible continuation evidence |
| CHoCH | An initial break against the established structure | Warning of a possible transition |
| Liquidity sweep | Price trades beyond a visible extreme and then rejects | Reason to wait for confirmation, not assume a break |
Some frameworks require a candle close beyond a swing. Others count a wick. Some distinguish internal from external structure or use “market structure shift” instead of CHoCH. Traders should document the definition used in their own testing.
Hypothetical chart case
Imagine EUR/USD forms:
- A higher high at 1.1100.
- A higher low at 1.1050.
- A new higher high at 1.1140.
- A decline that closes below 1.1050.
Under one common framework, the close below the prior higher low is a bearish CHoCH: the bullish sequence has been disrupted. It is not proof of a lasting reversal.
Price then retests 1.1050, rejects, and closes below a later low at 1.1000. That second break may be labelled bearish BOS because it continues the newly developing bearish sequence.
A trader considering a short after the retest might place invalidation above the retest swing. Position size would then be calculated from that distance. If the invalidation is too far away for the permitted minimum trade size, the correct decision may be to skip the trade.
Neither CHoCH nor BOS guarantees reversal or continuation. A news shock, liquidity sweep, or difference in swing selection can change the interpretation.

Leverage, Margin, and Risk Are Not the Same
Leverage is the relationship between exposure and capital. Margin is the deposit required to support leveraged exposure. Stop-based risk is the estimated loss between entry and the intended exit.
Assume a hypothetical EUR/USD position:
- Size: 20,000 units, or 0.20 lots
- Entry: 1.1000
- Notional value: $22,000
- Stop distance: 25 pips
- Approximate pip value: $2
- Planned price risk before costs: $50
| Available leverage | Approximate margin required | Stop-based price risk |
|---|---|---|
| 5:1 | $4,400 | $50 |
| 20:1 | $1,100 | $50 |
| 30:1 | $733.33 | $50 |
| 50:1 | $440 | $50 |
Leverage changes the margin required, but the chosen position size and stop distance determine the planned price loss. Higher available leverage becomes dangerous when it is used to increase exposure or stack positions.
Regulatory examples as of 2026
| Jurisdiction | Selected retail requirement | Important qualification |
|---|---|---|
| United States | NFA minimum security deposits of 2% for specified currencies and 5% for others, equivalent to 50:1 and 20:1 | Requirements can be increased during extraordinary conditions |
| United Kingdom | CFD leverage from 30:1 to 2:1; 50% account-level margin close-out; negative-balance protection | Applies to covered retail products and clients |
| Australia | 30:1 for major-pair CFDs and 20:1 for minor-pair CFDs | Current order is due to expire May 23, 2027 unless remade |
The US requirements reflect the NFA rules amended through March 18, 2026. UK controls are described in FCA Policy Statement PS19/18. Australian limits come from the ASIC CFD product-intervention order; ASIC confirmed in 2026 that it is scheduled to expire in 2027 unless remade.
These are regulatory ceilings, not recommended trading levels. Protections also depend on legal entity, location, client classification, and product. Verify the latest rules before funding an account.

Risk-to-Reward Ratio, Win Rate, and Expectancy
If a trade risks $100 to pursue $200, its planned reward-to-risk ratio is 2:1, often written as a potential +2R for a −1R risk.
Ignoring costs, the break-even win rate is:
Break-even win rate = 1 ÷ (1 + average reward-to-risk)
| Average win | Break-even win rate |
|---|---|
| 0.5R | 66.7% |
| 1.0R | 50.0% |
| 1.5R | 40.0% |
| 2.0R | 33.3% |
| 3.0R | 25.0% |
A 2R target is not automatically profitable. The target must be reached often enough, and realised winners must remain large enough after costs and trade management.
Expectancy can be estimated as:
Expectancy = (Win rate × Average win) − (Loss rate × Average loss)
Suppose a hypothetical 50-trade record contains:
- 20 winners averaging +1.6R
- 30 losers averaging −1R
Gross result:
(20 × 1.6R) − (30 × 1R) = +2R
Gross expectancy:
+2R ÷ 50 = +0.04R per trade
If spread, commission, financing, and slippage average 0.08R per trade, total costs are 4R. Net result becomes −2R, or −0.04R per trade.
Partial exits also change realised reward. Closing half at +1R and half at +2R produces +1.5R before costs, not +2R. Moving a stop to break-even may reduce full losses, but it may also exit trades that would later reach the target. Both effects must be measured in actual records.

Control Drawdown and Losing Streaks
Drawdown measures the decline from an account-equity peak to a later trough. Loss recovery is asymmetric:
| Drawdown | Gain required to recover |
|---|---|
| 5% | 5.3% |
| 10% | 11.1% |
| 20% | 25.0% |
| 25% | 33.3% |
| 30% | 42.9% |
| 50% | 100.0% |
The recovery formula is:
Required gain = Drawdown ÷ (1 − Drawdown)
This asymmetry is a reason to control large losses, not a reason to expect recovery.
A written drawdown protocol might say:
- At a 3% daily decline: stop for the session.
- At a 6% strategy drawdown: reduce risk per trade from 0.75% to 0.375%.
- At a 10% drawdown: stop live trading and review execution, costs, market conditions, and the original evidence.
- Resume normal size only after predefined review criteria are satisfied.
These thresholds are hypothetical illustrations, not universal recommendations.
A pause is more useful when it triggers a diagnosis. Ask whether the drawdown is within the strategy’s tested range, whether execution has deteriorated, whether rules were followed, and whether market behaviour has changed. Increasing risk to “win it back” compounds both mathematical and behavioural risk.

Manage Correlation and Total Currency Exposure
Counting positions is not enough. Each currency pair contains a long exposure and a short exposure.
| Position | Long exposure | Short exposure |
|---|---|---|
| Long EUR/USD | EUR | USD |
| Long GBP/USD | GBP | USD |
| Short USD/CHF | CHF | USD |
Although these are three pairs, all three positions are broadly exposed to US-dollar weakness. A sudden dollar rally could hurt them together.
Suppose each trade has a planned loss of $100. The nominal open risk is $300. Correlation does not allow a precise claim that the effective risk is exactly $300 at every moment, but a stress scenario in which all three stops are reached would lose approximately that amount before slippage and costs.
One possible policy for a $10,000 account might be:
- Maximum individual-trade risk: 1%
- Maximum total open risk: 3%
- Maximum shared currency-theme risk: 1.5%
- Maximum risk around one scheduled event: 1%
Under that hypothetical policy, three 1% trades expressing the same short-USD view would be rejected or reduced even though each trade individually passes the 1% rule.
Correlation also changes. Historical estimates can weaken or reverse, especially when one currency is responding to its own central bank or political event. Exposure mapping should therefore complement—not replace—scenario analysis.

Prepare for News, Gaps, Slippage, and Changing Liquidity
Scheduled central-bank decisions, inflation reports, employment data, elections, and market reopenings can produce wider spreads and fewer executable prices. A stop reduces risk but does not guarantee the planned loss.
Consider a hypothetical position:
- Position size: 0.50 lots
- Pip value: $5
- Stop distance: 20 pips
- Planned price loss: $100
If the market moves across the stop and the order fills seven pips beyond it:
27 pips × $5 = $135
The loss is $135 before any commission or financing—35% larger than planned.
Before carrying event exposure, choose deliberately among four actions:
- Accept it: Keep the position and size for plausible adverse execution.
- Reduce it: Cut exposure while retaining part of the thesis.
- Close it: Remove the event risk.
- Hedge it: Add an offsetting instrument only after considering basis risk and extra costs.
Order types also involve trade-offs:
- A normal stop prioritises exiting but not the exact price.
- A stop-limit controls the worst permitted price but may not execute.
- A guaranteed stop, where genuinely offered, can control the exit price but may carry a premium and eligibility conditions.
Check the broker’s definition of a trading day, rollover time, weekend policy, guaranteed-stop terms, negative-balance policy, and treatment of disconnected platforms.

Build a Complete Forex Risk-Management Plan
A risk plan should be short enough to use and specific enough to reject a trade.
Account rules
- Capital allocated to trading: ______
- Maximum risk per trade: ______
- Maximum total open risk: ______
- Maximum risk tied to one currency or macro theme: ______
- Maximum effective leverage: ______
- Minimum free-margin buffer: ______
Trade rules
- Approved setup definitions: ______
- Valid stop methods: ______
- Cost and slippage allowance: ______
- Minimum permitted position size: ______
- Minimum net expectancy or evidence standard: ______
- Rules for moving a stop: ______
- Rules for partial exits: ______
Loss and event rules
- Daily loss limit: ______
- Weekly loss limit: ______
- Drawdown level for reducing size: ______
- Drawdown level for stopping live trading: ______
- Restricted announcements: ______
- Weekend holding policy: ______
- Conditions for resuming normal risk: ______
Review process
For every position, record:
- Entry, initial stop, target, and position size
- Planned cash risk and planned R outcome
- Spread, commission, financing, and slippage
- Correlated positions already open
- Relevant scheduled events
- Whether the written rules were followed
- Realised result in money and R
- Screenshot and post-trade notes
Review planned versus realised loss. Repeated overruns can reveal underestimated costs, poor order handling, unstable liquidity, or rule violations.

Common Forex Risk-Management Mistakes
| Mistake | Why it happens | Likely consequence | Correction |
|---|---|---|---|
| Choosing lot size first | The trader focuses on potential profit | Stop is forced to fit the position | Place invalidation first, then calculate size |
| Moving the stop farther away | Reluctance to accept a loss | Risk becomes undefined | Treat the original invalidation as binding |
| Increasing risk after losses | Desire for rapid recovery | Drawdown accelerates | Use fixed or reduced percentage risk |
| Using all available margin | Buying power feels like affordable risk | Small moves cause large equity changes | Set an independent leverage ceiling |
| Ignoring costs | Calculator uses chart distance only | Real loss exceeds its budget | Add spread, commission, and slippage |
| Stacking correlated trades | Pairs appear different | One event harms several positions | Map exposure by currency and theme |
| Chasing a high win rate | Frequent wins feel safer | Occasional losses overwhelm gains | Track expectancy and average win/loss |
| Changing rules too quickly | A short losing streak creates doubt | No stable sample can be evaluated | Define review intervals in advance |
| Calling every break a BOS | Structure rules are vague | Stops and entries become inconsistent | Document swing and close criteria |
| Treating CHoCH as confirmation | Early transition is mistaken for certainty | Premature reversal trades | Require the evidence specified by the tested plan |

Forex Risk-Management Checklist
Before entering
- Is this an approved setup?
- Where is the objective invalidation level?
- Does the stop account for spread and normal volatility?
- What is the maximum cash loss?
- Has position size been calculated and rounded down?
- Are costs and plausible slippage included?
- What is total open risk if the order fills?
- Is the same currency already concentrated elsewhere?
- What scheduled events could affect execution?
- Is adequate free margin available?
- Does the broker’s order type behave as expected?
While the trade is open
- Do not widen the stop to avoid a planned loss.
- Do not add exposure unless the additional risk was planned.
- Recalculate total risk before opening another position.
- Follow the documented rules for partial exits and stop adjustments.
- Monitor material platform or market disruptions.
After the trade
- Record the result in money and R.
- Separate trading loss from transaction costs.
- Compare the planned stop with the actual fill.
- Mark any rule violation separately from strategy performance.
- Save the chart at entry and exit.
At the end of the week
- Calculate win rate, average win, average loss, and net expectancy.
- Review drawdown and currency concentration.
- Compare planned with realised risk.
- Investigate repeated slippage or cost overruns.
- Change rules only through the predefined review process.

Frequently Asked Questions
There is no universally correct percentage. The frequently cited 1% rule is better treated as a ceiling than a target. A beginner or trader testing an uncertain method may choose 0.25%–0.50% per trade, while recognising that even small losses accumulate. The decision should reflect affordable capital, total open exposure, execution risk, and tolerable drawdown.
First calculate cash risk, then divide it by the adjusted stop distance multiplied by pip value: Lots = Cash risk ÷ (Adjusted stop in pips × Pip value per standard lot) If a $10,000 account risks 1%, the cash limit is $100. With a 25-pip adjusted stop and a $10 pip value, the result is 0.40 standard lots. Round down if the exact size is unavailable.
No. A conventional stop normally triggers an order that executes at an available price. A gap, wider spread, poor liquidity, platform issue, or rapid market move can produce a worse fill. A genuine guaranteed stop may offer price certainty, but availability, premiums, and conditions vary.
No. Ignoring costs, an average 2R winner requires a win rate above 33.3% to be profitable. Spread, commission, slippage, financing, partial exits, and execution errors raise the required win rate. The relevant measure is net expectancy across a meaningful sample.
There is no safe universal number. Assess combined cash risk and shared currency exposure. Three positions risking 1% each create up to 3% nominal planned risk, and they may behave like one concentrated position if they share the same dollar, euro, or risk-sentiment theme.
Conclusion: Protect the Account Before Pursuing Returns
Effective Forex risk management follows a clear order: locate invalidation, set the cash-risk ceiling, calculate position size, check costs and margin, review correlated exposure, and document the result.
No rule can eliminate uncertainty, guarantee a stop price, or make a weak strategy profitable. Good controls make the uncertainty measurable and help prevent one decision from determining the account’s future.
Create a one-page risk plan using the template above, test it with historical data and a demo account, and review planned versus realised risk before committing capital.
Financial Risk Disclaimer
This content is for general educational purposes only and does not constitute investment, financial, legal, tax, or trading advice. Foreign-exchange and CFD trading involve substantial risk, particularly when leverage is used, and may not be appropriate for every person. Losses can occur rapidly and may exceed the amount planned where applicable protections are absent or execution differs from the requested price.
Examples in this article are hypothetical and exclude some broker-, tax-, and jurisdiction-specific factors. Past performance, backtests, risk-to-reward ratios, and market-structure signals do not guarantee future results. Before trading, consider your financial circumstances, obtain independent professional advice where appropriate, verify the latest rules with your regulator, and review the legal entity and terms of your broker. Never trade money you cannot afford to lose.