

 PIPAVO Team
Learn how to combine moving averages, ADX, market structure and risk controls in a testable Forex trend-following strategy for 2026.
In this article
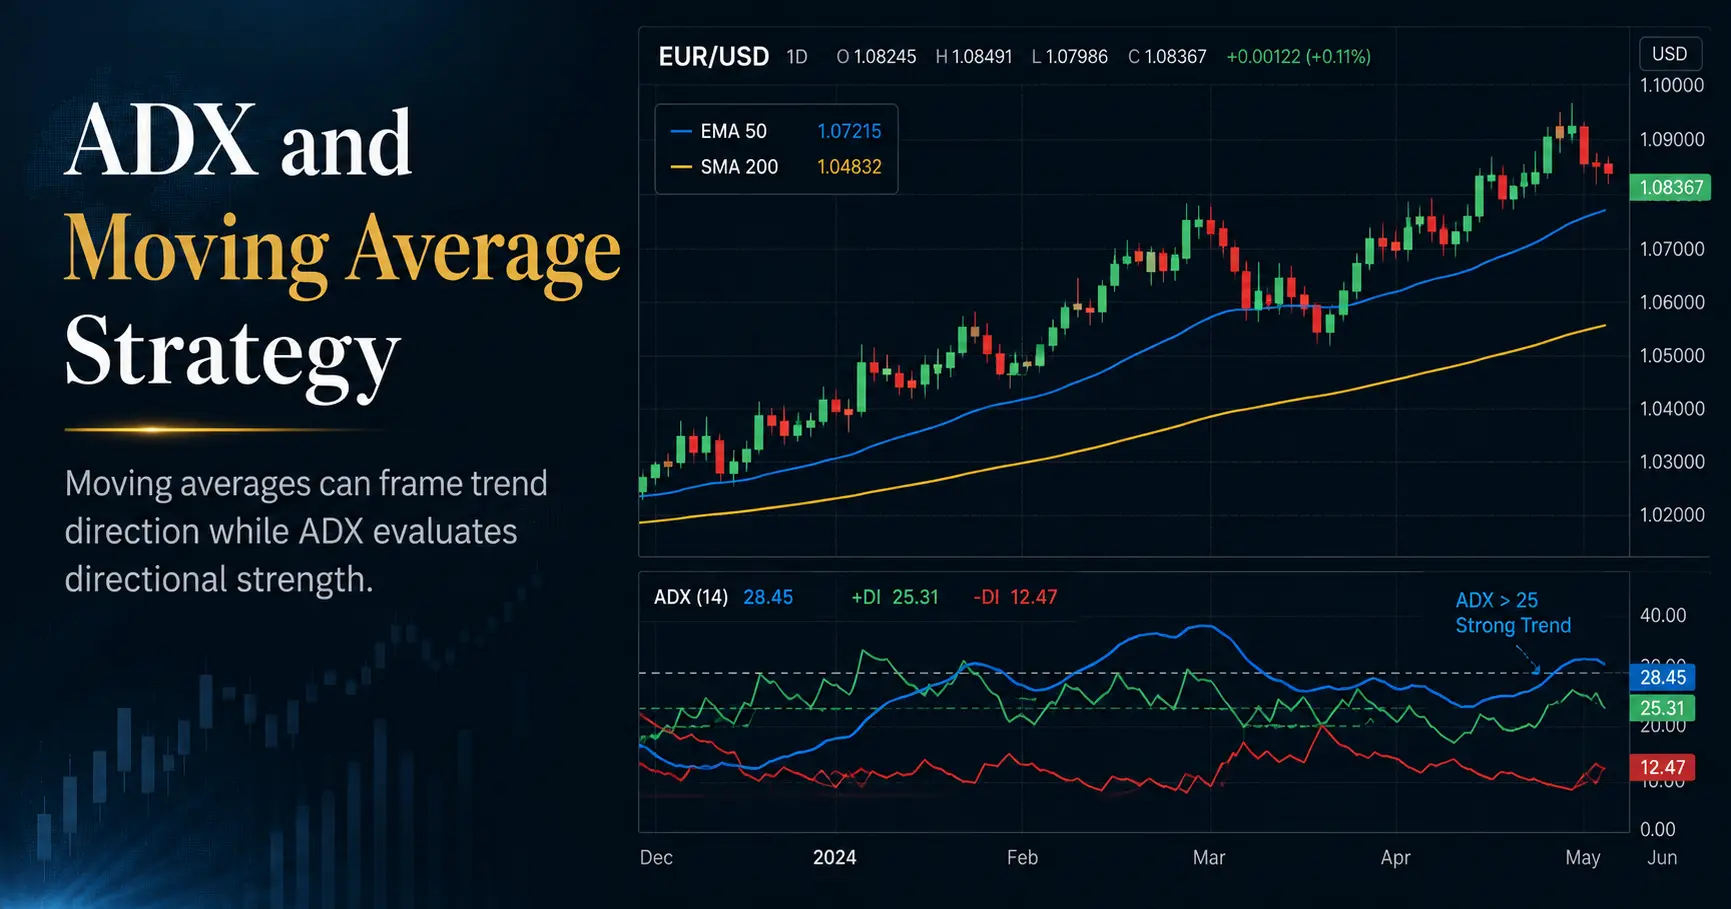
An ADX and moving average strategy combines a directional filter with a trend-strength filter: the moving average frames the likely trend, while ADX indicates whether directional movement is expanding or weak. It is not a complete signal by itself. This guide builds the combination into a testable Forex process using market structure, explicit entries and exits, position sizing, trading costs, and rules for avoiding weak conditions as of September 2026.
What Is an ADX and Moving Average Strategy?
A moving average smooths historical prices to provide directional context. The Average Directional Index, or ADX, measures the strength of directional movement without identifying whether that movement is bullish or bearish.
That division of labor matters. A high ADX reading can accompany either a strong rally or a strong decline.
| Component | Primary job | What it cannot establish alone |
|---|---|---|
| Moving average | Trend direction, slope and dynamic context | Whether the trend is strong enough to trade |
| ADX | Strength of directional movement | Bullish or bearish direction |
| +DI and −DI | Relative positive and negative directional pressure | A reliable entry price |
| Swing structure | Higher highs, higher lows, lower highs and lower lows | Exact position size |
| Price trigger | Confirms entry timing | Whether total risk is acceptable |
| Risk model | Defines exposure and invalidation | Whether the forecast will be correct |
A complete strategy therefore needs five decisions:
- Which direction is eligible?
- Is there sufficient trend strength?
- What observable price event triggers entry?
- Where is the idea invalid?
- How much capital can be lost if it fails?
Moving averages and ADX are both derived from historical price data. Their agreement is useful as a filter, but it is not two fully independent sources of evidence.

Why Trend Following May Work—and Where the Evidence Stops
As of September 2026, the latest BIS Triennial Survey reports that global FX turnover averaged $9.6 trillion per day in April 2025, a 28% increase from 2022. The US dollar was on one side of 89% of transactions. Because each FX trade contains two currencies, individual currency shares add to 200%, not 100%. Bank for International Settlements, 2025
Market size does not guarantee smooth trends, however. FX prices alternate among directional movement, consolidation, volatility shocks and reversals.
Research offers qualified support for trend persistence:
| Research | Sample and finding | Relevant limitation |
|---|---|---|
| Moskowitz, Ooi and Pedersen, 2012 | Studied 58 liquid futures and forwards, including currencies; found return persistence over approximately one to 12 months | Does not test this specific MA–ADX system or short-term retail execution |
| Dissecting Currency Momentum, 2022 | Found that systematic currency factors explain much measured currency momentum | Individual currency-pair behavior may contain less momentum than broad results imply |
| How to Maximize Momentum Returns in Foreign Exchange Markets, 2026 | Examined 42 countries and reported currency momentum over six-month holding periods | The portfolio method and holding period differ from an H4 technical strategy |
The 2012 study also reported an annualized Sharpe ratio of 1.1 in an earlier out-of-sample period, but that historical portfolio result should not be treated as an expected return for retail traders. Time Series Momentum, Journal of Financial Economics, 2012
Later research found that carry and broad dollar factors account for much of measured currency momentum, while idiosyncratic returns contain relatively little momentum. Dissecting Currency Momentum, 2022 A 2026 study provides more recent evidence of momentum across currencies from 42 countries, but again does not validate an MA–ADX ruleset. Journal of International Money and Finance, 2026
The correct conclusion is modest: trends have appeared historically, but the profitability of any specific implementation must be tested after spreads, slippage, financing and execution constraints.

How Moving Averages Define Forex Trend Direction
SMA versus EMA
A simple moving average, or SMA, gives equal weight to every price in its lookback window:
SMA = Sum of closing prices ÷ Number of periods
If five hypothetical closes are 1.1000, 1.1020, 1.1010, 1.1040 and 1.1080:
Five-period SMA = 5.5150 ÷ 5 = 1.1030
An exponential moving average, or EMA, gives greater weight to recent prices. For a five-period EMA, the conventional multiplier is:
2 ÷ (5 + 1) = 0.3333
If the previous EMA is 1.1000 and the latest close is 1.1060:
New EMA = 1.1000 + 0.3333 × (1.1060 − 1.1000) = 1.1020
These numbers are hypothetical calculations, not live exchange rates.
| Feature | SMA | EMA |
|---|---|---|
| Weighting | Equal | Greater weight on recent prices |
| Response | Slower | Faster |
| Typical trade-off | Later signal, potentially less noise | Earlier signal, potentially more whipsaws |
| Best choice | The version that survives robust testing | The version that survives robust testing |
Three useful MA readings
A moving average can be interpreted through:
- Price position: closes above the average favor long eligibility; closes below favor short eligibility.
- Slope: a rising average supports bullish context, while a falling average supports bearish context.
- Alignment: a fast average above a slower average supports bullish context; the reverse supports bearish context.
A crossover records a change that has already occurred in the underlying prices. It does not predict continuation. The shorter the averages, the faster they react—and the more frequently they can cross during noise.
Do not select a period because it produced the best historical result on one pair. Compare nearby settings, such as 40, 50 and 60 periods. A strategy that works only at exactly 50 may be overfitted.

How ADX and the Directional Indicators Work
ADX belongs to Wilder’s Directional Movement System. Many platforms use 14 periods as the default.
The calculation follows this sequence:
- Compare the current high with the previous high to obtain upward movement.
- Compare the previous low with the current low to obtain downward movement.
- Retain the dominant positive movement as +DM or dominant negative movement as −DM.
- Calculate true range from the current range and any gap from the previous close.
- Smooth true range, +DM and −DM.
- Convert them into +DI and −DI.
- Calculate DX from the absolute difference between +DI and −DI.
- Smooth DX to produce ADX.
A simplified expression is:
DX = 100 × |+DI − −DI| ÷ (+DI + −DI)
TradingView’s documentation describes the complete Wilder-style process and notes that ADX itself is non-directional. TradingView ADX documentation, accessed September 2026
Reading ADX correctly
| ADX condition | Possible interpretation | Appropriate response |
|---|---|---|
| Below 20 | Weak or poorly defined directional movement | Avoid forcing a trend trade |
| 20–25 | Transitional or ambiguous condition | Require stronger price confirmation |
| Above 25 and rising | Directional strength is expanding | Evaluate continuation without chasing |
| Above 25 and falling | Trend strength is contracting | Inspect structure; do not assume reversal |
| Very high after an extended move | Strong movement has already occurred | Check whether entry is late |
The 20 and 25 levels are conventional reference zones, not universal laws. TradingView attributes the below-20 and above-25 interpretation to Wilder, while also warning that false signals remain possible. TradingView, accessed 2026
A falling ADX can occur while an uptrend continues at a slower rate. It can also fall during a healthy pullback before rising again. Price structure—not ADX alone—must determine whether the trend has been invalidated.
Platform values can differ slightly because of smoothing, initialization and data-feed differences. Record the platform, indicator version and settings used in every test.

Market Structure Before Indicators: Swings, BOS and CHoCH
An uptrend normally forms higher highs and higher lows. A downtrend forms lower lows and lower highs. Moving averages summarize that behavior, but swings show where the trading idea actually becomes questionable.
BOS versus CHoCH
A Break of Structure, or BOS, is commonly used for a break in the direction of the established trend. In an uptrend, a close above the prior significant high may be labeled bullish BOS.
A Change of Character, or CHoCH, is commonly used for the first meaningful break against the established swing sequence. If an uptrend breaks below its protected higher low, some traders label that bearish CHoCH.
Interpretation varies:
| Event | Continuation framework | Reversal-focused framework |
|---|---|---|
| Break above an internal high during an uptrend | Bullish BOS | Internal continuation only |
| Break below a minor higher low | Pullback noise | Internal bearish CHoCH |
| Break below the major protected low | Trend invalidation | External bearish CHoCH |
| Lower high followed by a major lower-low break | Bearish confirmation | Bearish BOS after CHoCH |
This vocabulary is not universally standardized. A trader tracking internal swings may identify CHoCH earlier than one tracking only major external swings. The framework and selected swing must be defined before reviewing the outcome.
Liquidity and false breaks
Prior highs and lows may attract pending orders and protective stops. Traders often call these areas “liquidity pools,” but the exact order inventory is usually not visible on a retail chart. A brief move through a prior high is therefore not automatically a bullish BOS. Require a defined condition such as a candle close beyond the level, follow-through, or a successful retest.
Neither CHoCH nor BOS guarantees reversal or continuation. They describe observed price behavior, not future certainty.

A Complete MA and ADX Trend-Following Ruleset
The following is a hypothetical baseline for testing, not a recommendation or a proven optimal system.
Chart configuration
- Markets: EUR/USD, GBP/USD, USD/JPY and AUD/USD
- Timeframe: H4
- Direction filter: 50-period EMA of closing price
- Strength filter: Wilder ADX/DMI with 14 periods
- Trigger: close beyond the previous two completed candles
- Risk reference: recent swing or 14-period ATR
- Data rule: evaluate completed candles only
Long rules
- The latest completed candle closes above the EMA.
- The EMA is higher than it was three completed candles earlier.
- +DI is above −DI.
- ADX is at least 25 and higher than on the preceding completed candle.
- Price closes above the highest high of the previous two completed candles.
- The next resistance or external swing high leaves at least 2R of potential room.
- Enter at the next candle’s opening price, subject to the gap rule.
- Place the stop below the pullback swing or 1.5 ATR from entry, whichever test rule has been selected.
- Risk no more than the predefined account percentage.
- Exit at 2R, on a stop, or after a completed close below the EMA—according to the version being tested.
Short rules
Reverse the directional conditions:
- Close below a falling EMA.
- −DI above +DI.
- ADX at least 25 and rising.
- Close below the previous two-bar low.
- Stop above the pullback swing or at the tested ATR distance.
Cancel or skip the setup when
- ADX qualifies only after price has become substantially extended.
- The entry gap exceeds 0.5 ATR.
- The trigger candle is larger than 1.75 ATR.
- A major scheduled announcement is close enough to violate the trading plan.
- Available room before structure is less than 2R.
- Spread exceeds the tested maximum.
- Two related positions would breach the portfolio risk limit.
The numerical settings above are research variables. They should remain fixed during a test and then undergo sensitivity analysis.

Worked Forex Trade Example with Position Sizing
Consider a hypothetical EUR/USD H4 long setup:
| Item | Hypothetical value |
|---|---|
| Account balance | $10,000 |
| Maximum risk | 0.50% |
| Monetary risk limit | $50 |
| EMA(50) | 1.0890 and rising |
| ADX(14) | Rises from 24.6 to 25.4 |
| +DI / −DI | 27 / 18 |
| Entry after spread | 1.0920 |
| Structural stop | 1.0870 |
| Price risk | 50 pips |
| Planned target | 1.1020 |
| Gross reward | 100 pips |
| Gross reward-to-risk | 2:1 |
For EUR/USD in a USD-denominated account, one standard lot has an approximate pip value of $10. At 0.10 lot, it is approximately $1 per pip.
The simple position-size calculation is:
Lot size = $50 ÷ (50 pips × $10 per pip per standard lot)
Lot size = 0.10 standard lot
Now include hypothetical adverse slippage of 0.3 pip at the stop:
Adjusted loss distance = 50.3 pips
Unrounded size = $50 ÷ (50.3 × $10) = 0.0994 lot
If the broker permits increments of 0.01 lot, round down to 0.09 lot. Approximate loss after 50.3 pips becomes:
50.3 × $0.90 = $45.27
If the target fills after 99.7 favorable pips:
99.7 × $0.90 = $89.73
That is approximately 1.98R, using $45.27 as the realized loss unit. Commission and overnight financing were assumed to be zero here; if applicable, they must be deducted.
The setup is cancelled if price gaps significantly above 1.0920, ADX eligibility disappears before entry, or the remaining room to resistance falls below the required 2R.

Reading Trend Transitions with MA, ADX, CHoCH and BOS
A transition should be read as a sequence rather than a single indicator event.
| Stage | Price structure | MA and ADX behavior | Practical response |
|---|---|---|---|
| Established trend | Higher highs and higher lows | Price above rising MA; ADX rising | Manage valid longs; avoid chasing |
| Pullback | Minor low breaks but protected low holds | ADX may decline; MA still rising | Wait for continuation evidence |
| Possible CHoCH | Protected higher low breaks | Price approaches or crosses MA | Stop treating longs as automatically eligible |
| Uncertain transition | Overlapping swings or failed break | MA flattens; ADX often falls | Stand aside |
| Bearish confirmation | Lower high followed by lower-low break | Price below falling MA; −DI leads; ADX rises | Evaluate new short setups |
A declining ADX at stage two does not prove reversal. Conversely, a high ADX after a bearish structural break may still reflect the strength of the preceding move because ADX is smoothed. Price usually changes before a lagging indicator fully reflects the transition.
[IMAGE 9 — sequential chart-reading case study | alt: Five-stage Forex trend transition from uptrend through CHoCH to possible bearish BOS | caption: Trend transitions develop through structure, confirmation and failure—not through one ADX reading.]
When the Strategy Should Not Be Traded
| Condition | Why it is unsuitable | Corrective action |
|---|---|---|
| Flat EMA with repeated crossings | Direction is poorly defined | Wait for slope and structure alignment |
| ADX below 20 | Directional movement may be weak | Use a separate range system or do nothing |
| Entry far from the EMA and swing stop | Reward relative to risk deteriorates | Wait for a controlled pullback |
| Oversized announcement candle | Stop and fill assumptions become unstable | Wait until spread and structure normalize |
| Conflicting timeframes | The setup may be a pullback against a larger trend | Define which timeframe controls eligibility |
| Resistance closer than the target | The planned reward is structurally constrained | Reduce target only if tested; otherwise skip |
| Abnormally wide spread | Costs alter entry, stop and expectancy | Enforce a maximum-spread rule |
A high ADX does not override poor location. If ADX reaches the threshold only after several large candles, the market may be strongly trending while the proposed entry remains unattractive.

Risk Management Beyond a Single Trade
Risk percentage and drawdown
Risk per trade determines how quickly a losing sequence damages the account. In a hypothetical $10,000 account:
| Ten consecutive losses | Approximate remaining balance | Drawdown |
|---|---|---|
| Risking 0.50% each time | $9,511.10 | 4.89% |
| Risking 1.00% each time | $9,043.82 | 9.56% |
| Risking 2.00% each time | $8,170.73 | 18.29% |
These figures use compounding and exclude costs:
Remaining balance = Starting balance × (1 − risk rate)^number of losses
They illustrate arithmetic, not a recommended risk percentage.
Leverage is not the same as risk
A highly leveraged account can still use small position risk, while a poorly placed stop can expose a supposedly conservative account to excessive loss.
The CFTC’s 2022 advisory describes US minimum security deposits of 2% for major currency pairs and 5% for other pairs, equivalent to maximum leverage of 50:1 and 20:1. These are US-specific figures, not global rules. Readers should verify requirements with their local regulator and authorized broker. CFTC, 2022
Correlated currency exposure
Three trades are not necessarily three independent risks:
- Long EUR/USD
- Long GBP/USD
- Short USD/CHF
All three broadly express US-dollar weakness. If each risks 0.5%, the portfolio may behave more like one concentrated 1.5% USD position than three diversified ideas.
Measure risk by shared currency and macroeconomic driver, not merely by the number of tickets.
Reward-to-risk versus win rate
A hypothetical system winning 40% of trades with an average 2R win and 1R loss has expectancy before costs of:
(0.40 × 2R) − (0.60 × 1R) = 0.20R per trade
A positive historical expectancy can disappear after spread, slippage, financing or changing market behavior.
The CFTC reported that roughly two out of three customers at registered US OTC Forex dealers lost money after costs. Its cited account sample covered Q2 2021 through Q1 2022, so it should not be misrepresented as a fresh 2026 loss rate. CFTC Customer Advisory, 2022

How to Backtest the MA–ADX Strategy Properly
Step-by-step validation process
- Convert every rule into an unambiguous condition.
- Define the pair, timeframe, session and data source.
- Use only information available at each historical candle.
- Enter no earlier than the rule permits.
- Apply spread, commission, slippage and overnight financing.
- Include skipped trades and cancelled setups.
- Separate development data from out-of-sample evaluation.
- Test different volatility and trend regimes.
- Compare the MA-only strategy with the MA-plus-ADX version.
- Forward-test unchanged rules on a demo account.
Minimum reporting table
| Metric | Why it matters |
|---|---|
| Number of trades | Shows whether the sample is large enough to study |
| Win rate | Describes frequency, not profitability by itself |
| Average win and loss in R | Reveals payoff asymmetry |
| Expectancy | Estimates average outcome per trade before uncertainty |
| Maximum drawdown | Measures historical peak-to-trough loss |
| Profit factor | Gross profit divided by gross loss |
| Cost per trade | Shows how execution affects the edge |
| Long/short and pair results | Identifies concentration |
| Out-of-sample result | Tests whether performance survived unseen data |
Robustness checks
Test nearby EMA periods and ADX thresholds. The objective is not to find the highest historical profit; it is to determine whether the logic remains viable under small changes.
Also test:
- ADX level alone versus level plus rising slope
- EMA crossover versus price-position rules
- Swing stop versus ATR stop
- 1.5R, 2R and trailing exits
- Normal spread versus stressed spread
- Each pair separately and as a portfolio
Reject any result that depends on future information, unrealistic fills or a narrow parameter combination.

Common MA and ADX Trading Mistakes
| Mistake | Why it happens | Correction |
|---|---|---|
| Buying whenever ADX exceeds 25 | ADX is mistaken for direction | Require MA, DI and price alignment |
| Exiting whenever ADX falls | Weakening strength is confused with reversal | Exit using tested price or structure rules |
| Trading every MA crossover | Crossovers look clear in hindsight | Apply trend-strength and structure filters |
| Entering after an extended move | High ADX creates fear of missing out | Enforce distance, candle-size and room-to-target rules |
| Moving the stop farther away | The trader avoids accepting invalidation | Fix risk before entry and never increase it impulsively |
| Changing settings after losses | Normal variance feels like system failure | Review only after a predefined sample |
| Optimizing one pair | Historical noise is mistaken for an edge | Use out-of-sample and multi-pair tests |
| Adding more indicators | More lines feel like more certainty | Give each tool one distinct job |
The most important correction is to separate a market observation from a trade decision. “ADX is rising” is an observation. A trade exists only after direction, structure, trigger, cost and risk conditions agree.

MA and ADX Strategy Checklist
Before the session
- Confirm the approved pairs and timeframe.
- Note major scheduled announcements.
- Record the maximum permitted spread and portfolio risk.
- Check existing exposure by currency.
Before entry
- Is price on the eligible side of the MA?
- Does the MA have the required slope?
- Is the relevant swing structure clear?
- Do +DI and −DI support the direction?
- Does ADX satisfy the tested level and slope rules?
- Has a completed candle triggered entry?
- Is the setup too extended?
- Is there sufficient room to the next obstacle?
- Are stop, position size and maximum loss calculated?
- Does the order keep total correlated exposure within limits?
During and after the trade
- Do not widen the stop to avoid a planned loss.
- Follow the tested exit rule rather than reacting to every ADX change.
- Record actual spread, slippage and financing.
- Save the chart before and after execution.
- Review rule compliance separately from profit or loss.

Frequently Asked Questions
There is no universally best setting. Wilder ADX with 14 periods is a common starting point, while 20 and 25 are conventional reference zones for weak and stronger directional movement. The best defensible setting is one that remains stable across nearby parameters, unseen data, realistic costs and multiple market regimes.
No. ADX measures strength, not direction. ADX above 25 can occur in either a rising or falling market. Long eligibility still requires bullish direction from price, the moving average or +DI/−DI, followed by a separate entry trigger.
An EMA reacts more quickly, while an SMA changes more slowly. Neither is inherently superior. A 50-period EMA can be used as a transparent baseline, but it must be tested against nearby periods and an MA-only control strategy.
Yes. Falling ADX means directional strength is contracting, not necessarily that direction has reversed. Price may continue higher at a slower rate, consolidate above support or make a normal pullback. The relevant swing structure should control the exit decision.
No. CHoCH is an early structural warning under many trading frameworks. It can fail, represent internal noise or lead to a range. Some traders require a lower high and subsequent bearish BOS before treating a bullish trend as reversed. Conclusion: Use MA and ADX as a Framework, Not a Forecast An effective ADX and moving average strategy separates four decisions: the moving average frames direction, ADX evaluates strength, price structure supplies context, and risk rules determine whether the trade is acceptable. The indicators cannot eliminate lag, false breaks or losses. Their value comes from making decisions more consistent and testable. Write the rules, include costs, compare the system with an MA-only control, test unseen data, and forward-test without changing parameters before considering live capital.
Financial Risk Disclaimer
This material is provided for general education and does not constitute investment advice, a recommendation, a trading signal or an offer to buy or sell any financial instrument. All trade examples and prices are hypothetical.
Forex and CFD trading involve substantial risk. Leverage magnifies gains and losses, and losses may exceed the amount initially allocated to a position depending on the product, broker and jurisdiction. Historical research, backtests and demo results do not guarantee future performance. Trading costs, liquidity, gaps, execution quality and changing market conditions can materially alter results.
Assess your financial circumstances, experience and risk tolerance before trading. Verify broker authorization, product protections and leverage restrictions with the relevant regulator in your jurisdiction. Consider obtaining advice from an appropriately licensed financial professional.