

 PIPAVO Team
Learn price action trading through market structure, BOS, CHoCH, liquidity, risk control, and a worked Forex example for 2026.
In this article
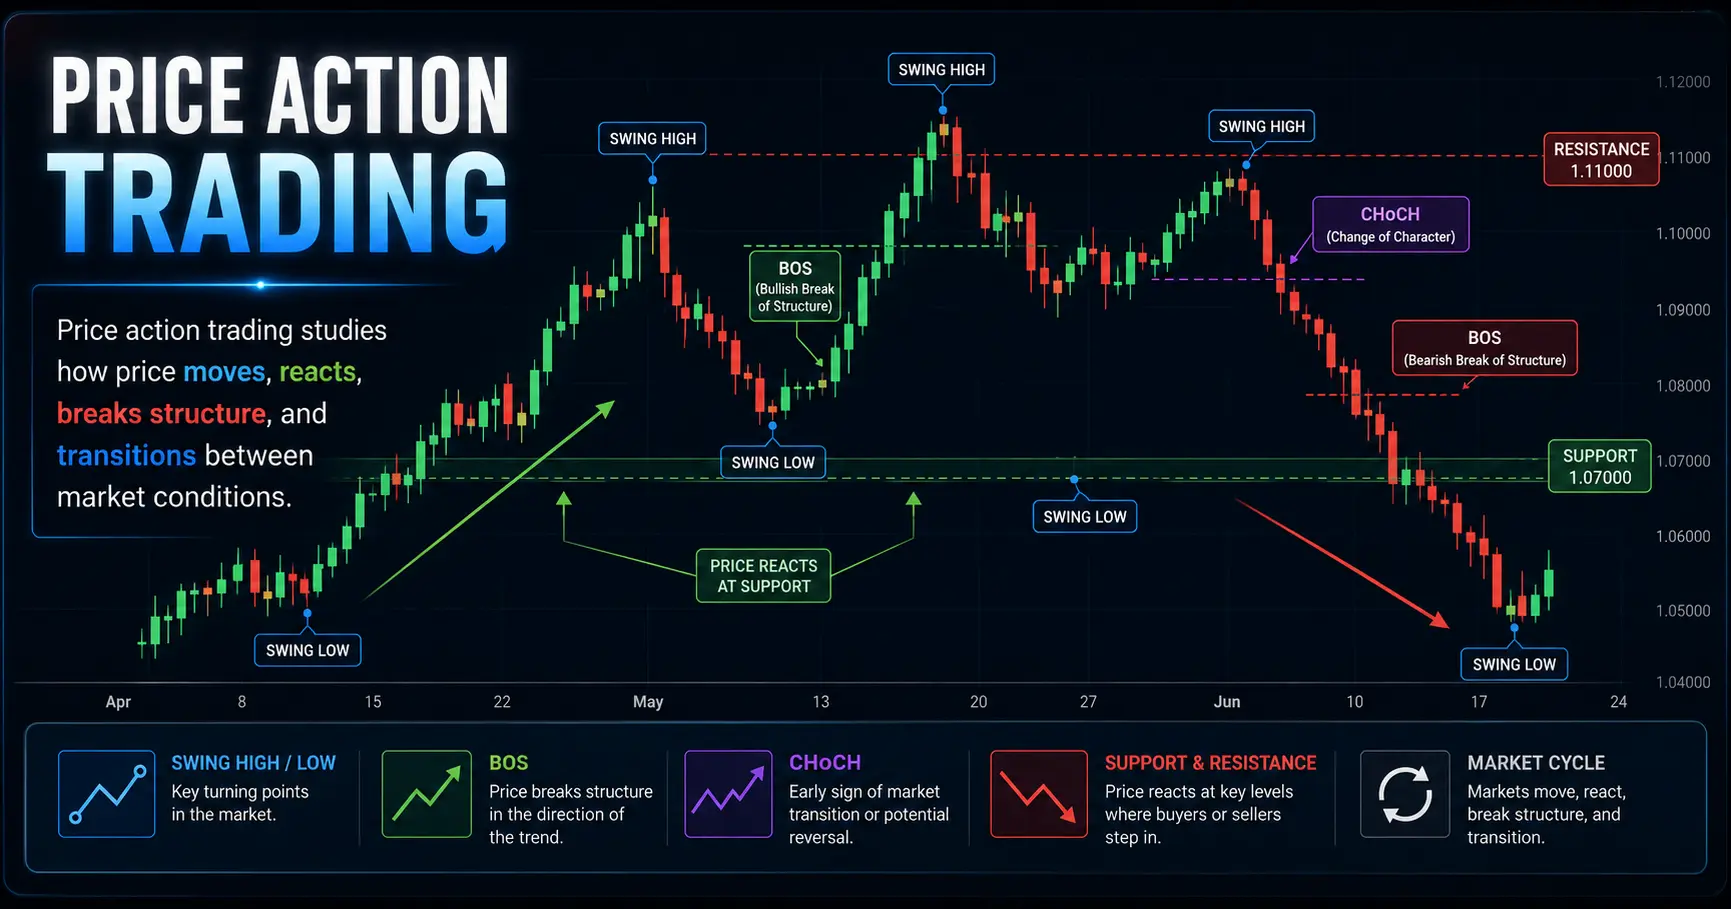
Price action trading is the practice of making trading decisions from price movement itself, including candles, swing structure, momentum, and reactions around important areas. It does not predict the market with certainty. A practical price action process combines chart context, a defined entry trigger, structural invalidation, position sizing, and evidence from a sufficiently large sample of trades.
What Is Price Action Trading?
Price action trading analyzes changes in price without depending primarily on mathematically derived indicators. Traders study what the market has already done: where it advanced, where it failed, how quickly it moved, and whether it accepted or rejected a price area.
The approach commonly uses:
- Candlestick behavior
- Swing highs and swing lows
- Trends and trading ranges
- Support and resistance zones
- Breakouts and failed breakouts
- Market-structure shifts
- Volatility expansion and compression
- Multi-timeframe context
“Pure price behavior” does not mean that a chart reveals every order or the intentions of every participant. It means the trader gives priority to observable price movement rather than allowing an indicator to make the decision.
As of August 2026, the latest final Bank for International Settlements data cover trading in April 2025. The BIS reports average global over-the-counter foreign-exchange turnover of $9.6 trillion per day, up 28% from $7.5 trillion in its 2022 survey. Spot FX accounted for approximately $3 trillion, or 31% of total turnover, while FX swaps remained the largest instrument category at about $4 trillion per day.
The scale of this market does not make price action easy to trade. It means price reflects the combined activity of banks, asset managers, corporations, governments, algorithmic firms, brokers, and individual traders operating for different reasons and across different venues.
Price action versus indicator-based trading
| Feature | Price action approach | Indicator-based approach | Combined approach |
|---|---|---|---|
| Primary input | Candles, swings, levels and structure | Calculations derived from historical price or volume | Price structure supported by selected indicators |
| Main strength | Direct view of price behavior | Consistent mathematical rules | Can combine context with objective filters |
| Main weakness | Interpretation can be subjective | Signals can lag or become redundant | More variables can encourage overfitting |
| Typical error | Seeing patterns after the outcome | Treating crossover signals as certainty | Adding filters until historical results look perfect |
| Best practice | Define structure and invalidation objectively | Understand what each calculation measures | Give every tool one specific role |
An indicator is not automatically inferior because it is derived from price. A moving average may help define trend direction, while an Average True Range calculation may help normalize volatility. The key question is whether the tool adds information to a tested process or merely decorates the chart.

What Information Can Price Reveal?
Price can provide evidence about four broad conditions: direction, momentum, volatility, and acceptance.
Direction
A directional market makes sustained progress rather than repeatedly returning to the same central area.
A bullish sequence commonly contains:
- Higher swing highs
- Higher swing lows
- Pullbacks that remain above important prior lows
- Bullish advances that cover more distance than bearish retracements
A bearish sequence shows the opposite behavior.
Direction is not established by one green or red candle. It emerges from a sequence of movements.
Momentum
Momentum describes the force or persistence of a move. On a chart, traders often assess it through:
- Candle range
- Body size relative to the wick
- Closing position
- Speed of movement
- Overlap between consecutive candles
- Distance traveled before a pullback
For example, five large bullish candles closing near their highs with limited overlap show different behavior from ten small, overlapping bullish candles that repeatedly reject higher prices.
The first sequence indicates strong directional progress. The second may indicate weak movement, compression, or a market approaching resistance.
Volatility
Volatility concerns the amount and speed of price movement, not its direction.
| Condition | Observable behavior | Practical implication |
| Expansion | Wider candles and faster movement | Stops may need more room; chasing becomes dangerous |
| Contraction | Narrow ranges and increasing overlap | A breakout may be approaching, but direction remains unknown |
| Stable trend | Consistent swings and orderly pullbacks | Structure-based planning may be easier |
| Erratic volatility | Large candles in both directions | Entries and stop placement become less reliable |
| Quiet range | Small candles contained between boundaries | Transaction costs may consume a larger share of the target |
Acceptance and rejection
A brief move through a level followed by a quick reversal suggests rejection. Repeated closes and continued trading beyond the area suggest acceptance.
This distinction is more useful than asking only whether a line was touched.
Consider resistance at 1.2500:
- A wick reaches 1.2510 and the candle closes at 1.2470: possible rejection.
- Three candles close above 1.2500 and pullbacks hold at 1.2495: possible acceptance.
- Price trades repeatedly on both sides of 1.2500: the level may no longer provide a clear boundary.
None of these outcomes guarantees what happens next. They describe the evidence available at that moment.
A price-reading checklist
Before looking for an entry, answer:
- Is the market trending, ranging, compressing, or transitioning?
- Which swing points are structurally important?
- Is momentum strengthening or weakening?
- Is price accepting or rejecting the current area?
- Is the current move occurring at a meaningful location?
- What price would prove the trade idea wrong?

How to Read Candlesticks Without Memorizing Patterns
A candlestick summarizes the open, high, low, and close for a defined period.
Its body shows the distance between the opening and closing prices. Its wicks show the highest and lowest prices recorded during the period.
That information is useful, but candle names should not replace context.
Closing location matters
A bullish candle closing near its high shows that buyers maintained control into the close of that period. A bullish candle with a large upper wick and a close near its midpoint shows that higher prices met stronger resistance.
The second candle is not necessarily bearish. It may simply show reduced bullish momentum.
Range and overlap matter
Suppose a market prints the following hypothetical hourly ranges:
| Candle | Range | Close position | Overlap with prior candle |
| 1 | 18 pips | Near high | — |
| 2 | 22 pips | Near high | Low |
| 3 | 26 pips | Near high | Low |
| 4 | 9 pips | Midpoint | High |
| 5 | 7 pips | Near low | High |
Candles 1–3 show directional expansion. Candles 4–5 show declining range, increased overlap, and weaker closes. This does not confirm a reversal, but it warns that the original momentum is fading.
Wicks are evidence, not automatic signals
A long lower wick can mean that lower prices were rejected, but several explanations remain possible:
- Buyers entered below the previous range.
- Sellers took profits.
- A temporary liquidity shortage caused a sharp movement.
- A news event widened spreads and increased volatility.
- Price swept below a visible low before returning.
- The wick occurred in the middle of a range and has little structural importance.
The location of the wick determines whether it deserves attention.
The same candle in three locations
Imagine the same bullish engulfing candle appears in three places:
| Location | Possible interpretation | Better response |
| At higher-timeframe support after a failed breakdown | Potential bullish rejection | Wait for structure or follow-through confirmation |
| Directly below major resistance | Late bullish momentum | Avoid assuming the candle can break resistance |
| In the middle of a range | Indecision within noise | Usually wait for a range boundary or breakout |
The pattern has not changed. Its meaning has.

Swing Highs, Swing Lows, and Market Structure
Market structure organizes price into meaningful advances and pullbacks.
A swing high is a local peak from which price moves lower. A swing low is a local trough from which price moves higher.
The difficult part is deciding which turns matter.
Significant swings versus minor fluctuations
A useful structural swing usually has one or more of these characteristics:
- Price moves away from it with visible displacement.
- It precedes a break of an earlier swing.
- It forms at a higher-timeframe zone.
- It defines the boundary of a clear range.
- A later move through it changes the market narrative.
- It remains visible when the chart is viewed at a slightly wider scale.
A two-pip fluctuation inside a 100-pip advance may be a lower-timeframe swing but not a meaningful structural point on the current chart.
External and internal structure
External structure describes the larger swing range controlling the chart. Internal structure describes smaller movements inside that range.
For example:
- External high: 1.1200
- External low: 1.0800
- Internal swing high: 1.1050
- Internal swing low: 1.0960
A break above 1.1050 may alter internal momentum while leaving the broader 1.0800–1.1200 range intact.
This distinction is essential when interpreting BOS and CHoCH. A lower-timeframe break may be significant for a short-duration trade but irrelevant to the daily trend.
A repeatable swing-marking process
- Begin at the left side of the chart.
- Mark the most obvious high and low from which price moved decisively.
- Identify which subsequent move broke a prior meaningful point.
- Retain the swing responsible for that break.
- Label smaller fluctuations as internal structure.
- Continue from left to right without changing earlier labels because of later outcomes.
- Record the exact rule used.
A trader might require two candles on either side of a turning point. Another might require displacement and a structural break. Neither rule is universally correct, but changing the rule from chart to chart makes testing unreliable.

Identifying Trends, Ranges, and Transitions
A price action strategy must fit the market condition. A continuation setup designed for a trend may perform poorly in a noisy range.
Bullish and bearish trends
A bullish market generally produces higher highs and higher lows. A bearish market generally produces lower lows and lower highs.
That definition becomes more useful when combined with strength:
- Are advances larger than pullbacks?
- Do pullbacks remain orderly?
- Does price close beyond prior highs or merely wick through them?
- Does the market hold above broken resistance?
- Is the structure visible on the higher timeframe?
Ranges
A range contains repeated movement between an upper and lower boundary without sustained acceptance outside either side.
Common range behavior includes:
- Breakouts that quickly return inside
- Frequent candle overlap
- Repeated tests of both boundaries
- Strong movement near the edges but little progress through them
- Unclear structure near the midpoint
The middle of a range often offers poor asymmetry. The distance to both boundaries is limited, while directional conviction is low.
Compression and expansion
Compression occurs when swing size and candle range decline. It reflects reduced movement, not a guaranteed breakout direction.
Expansion occurs when price leaves that balance with wider ranges and greater displacement.
A breakout trader might wait for a close beyond the compressed range and a successful hold. A reversal trader may instead wait for a failed break and re-entry.
Transition
A trend can transition before it fully reverses.
Possible warning signs include:
- Failure to create a meaningful new high or low
- Deeper pullbacks
- Reduced momentum in the trend direction
- Stronger opposing candles
- Break of an internal swing
- Repeated inability to hold beyond a breakout point
These signs justify caution. They do not prove a reversal.
| Market condition | Structure | Suitable focus | Common mistake |
| Bullish trend | Higher highs and higher lows | Pullbacks and continuation | Selling every upper wick |
| Bearish trend | Lower lows and lower highs | Rallies and continuation | Buying because price “looks cheap” |
| Range | Stable upper and lower boundaries | Edge reactions or confirmed breakout | Trading the midpoint |
| Compression | Narrowing swings | Prepare conditional scenarios | Predicting breakout direction |
| Transition | Conflicting internal and external structure | Reduce size or wait | Declaring a reversal too early |

What Is a Break of Structure?
A Break of Structure, commonly shortened to BOS, is usually defined as a break of a meaningful swing in the direction of the established trend.
Under that framework:
- A bullish BOS occurs when an established bullish market breaks above a meaningful prior swing high.
- A bearish BOS occurs when an established bearish market breaks below a meaningful prior swing low.
BOS is descriptive. It states that price has extended the structure. It does not guarantee another extension.
Wick break versus candle-close break
Frameworks differ on what qualifies as a break.
| Rule | Advantage | Limitation |
| Any wick through the swing | Detects the earliest penetration | Produces more false or ambiguous breaks |
| Candle close beyond the swing | Requires stronger acceptance | Enters or confirms later |
| Close plus successful retest | Adds evidence that the level is holding | May miss moves that do not retest |
| Displacement close beyond the swing | Filters weak marginal breaks | “Displacement” still needs an objective definition |
A trader must choose one rule before testing.
Internal versus external BOS
Suppose a four-hour bullish range extends from 1.0800 to 1.1200. Inside it, the one-hour chart breaks above an internal high at 1.1050.
That may be a one-hour bullish BOS. It is not necessarily a four-hour external BOS until price breaks and accepts above 1.1200.
Four-stage bullish BOS example
- Price establishes a higher low at 1.0900.
- It advances to 1.1000.
- A pullback holds at 1.0950.
- Price closes above 1.1000 at 1.1020.
Under a candle-close framework, the close at 1.1020 confirms a bullish BOS.
The trader still needs to ask:
- Did the break occur directly into higher-timeframe resistance?
- Was the breakout candle unusually extended?
- Did price hold above 1.1000?
- Is the stop distance reasonable?
- Does the setup retain sufficient reward after costs?
A BOS at a poor location can fail immediately.

What Is a Change of Character?
A Change of Character, or CHoCH, generally refers to an initial structural break against the prevailing directional sequence.
In a bullish trend, a break below a meaningful higher low may be labeled a bearish CHoCH. In a bearish trend, a break above a meaningful lower high may be labeled a bullish CHoCH.
CHoCH is best treated as a warning that behavior has changed—not as confirmation that a new trend has begun.
Successful and failed CHoCH scenarios
Consider a hypothetical bullish market:
- Swing low: 1.0800
- Swing high: 1.1000
- Higher low: 1.0920
- New high: 1.1080
Price then falls and closes below 1.0920.
That break may be classified as a bearish CHoCH. Two outcomes are possible.
Potential reversal sequence
- Price closes below 1.0920 with bearish displacement.
- A rally retests 1.0920–1.0950 and fails.
- Price forms a lower high.
- It breaks the next major low.
The evidence now supports a stronger bearish transition.
Failed CHoCH sequence
- Price briefly closes below 1.0920.
- It immediately reclaims the level.
- The market closes above the breakdown candle.
- It resumes the original bullish trend.
The initial CHoCH becomes a failed break rather than a confirmed reversal.
Internal CHoCH versus higher-timeframe change
A five-minute bearish CHoCH inside a daily bullish pullback may merely show short-term weakness. It does not automatically overturn the daily trend.
The label must therefore include its timeframe:
- Five-minute internal bearish CHoCH
- One-hour structural bearish CHoCH
- Daily external bearish break
This prevents a minor movement from being presented as a market-wide reversal.

BOS vs CHoCH: The Critical Difference
The simplest distinction is:
- BOS: evidence of continuation within the existing structural direction.
- CHoCH: evidence of a possible transition against that direction.
The distinction is useful, but it is not standardized across every trading framework.
Some traders label the first opposing break as CHoCH and the next confirming break as BOS in the new direction. Others use “market structure shift,” “trend break,” or “reversal break.” Some require a close beyond the swing, while others accept a wick.
BOS versus CHoCH comparison
| Feature | BOS | CHoCH |
| Relationship to prior trend | Usually follows the established direction | Usually breaks against the established direction |
| Primary use | Continuation evidence | Transition warning |
| Typical structural target | Prior high in bullish trend or prior low in bearish trend | Last protected low or high |
| Does it confirm the future? | No | No |
| Stronger when | Break has displacement and holds | Break is followed by lower high/higher low and further confirmation |
| Weaker when | It occurs into major opposition | It breaks only minor internal structure |
| Common error | Assuming continuation is guaranteed | Assuming reversal is guaranteed |
A consistent labeling framework
For this article:
- Trend is defined from meaningful external swings.
- A close beyond a swing is required for confirmation.
- A continuation break is labeled BOS.
- The first opposing structural break is labeled CHoCH.
- A CHoCH must be followed by additional structure before a reversal is considered established.
- Internal and external structure are labeled separately.
A different trader can use another framework, but the rules must remain consistent during testing.
The label is less important than the underlying questions:
- What exactly was broken?
- On which timeframe?
- Did price close beyond it?
- Did price remain beyond it?
- Where did the break occur?
- What would invalidate the interpretation?

Support, Resistance, Liquidity, and False Breakouts
Support and resistance are better treated as areas than exact prices. Orders, stop levels, and trading decisions are rarely concentrated at one perfectly precise line.
Evaluating a zone
A useful zone can be assessed through five questions:
| Factor | Stronger evidence | Weaker evidence |
| Structural importance | Caused a major break or reversal | Produced only a minor pause |
| Departure | Fast movement away | Slow, overlapping movement |
| Freshness | Few subsequent tests | Repeatedly tested |
| Higher-timeframe alignment | Visible on daily or four-hour chart | Exists only on a very low timeframe |
| Available space | Clear room to the next barrier | Immediate opposing zone |
Repeated testing can weaken a level because each interaction may consume available orders. However, repeated tests can also indicate building pressure before a breakout. The response must be read from subsequent price behavior rather than assumed in advance.
Liquidity in practical terms
Liquidity describes the ability to transact without causing excessive price movement. In chart-based retail education, the term is often used more narrowly to describe areas where stop or breakout orders may cluster, such as:
- Above a clear prior high
- Below a clear prior low
- Above equal highs
- Below equal lows
- Outside a well-defined range
A stop order is generally activated when its specified price condition is met and then becomes executable according to the product and broker’s order rules. A stop price is therefore not always a guaranteed fill price. NFA guidance for US retail Forex dealers specifically addresses slippage and prohibits firms from claiming guaranteed fills or “no slippage” unless they can substantiate those claims.
Sweep versus genuine breakout
A liquidity sweep is commonly used to describe price moving beyond an obvious level and then returning.
The penetration itself is not enough. Evaluate what follows.
| Outcome after the break | Interpretation |
| Immediate rejection and strong close back inside | Possible failed breakout or sweep |
| Several closes beyond the level | Possible acceptance |
| Break, retest and continuation | Stronger breakout evidence |
| Re-entry followed by opposing structure break | Stronger reversal evidence |
| Repeated movement on both sides | Level may no longer be useful |
Avoid assuming that an institution deliberately targeted an individual trader’s stop. A chart can show where price moved; it cannot identify every participant’s motive.

Multi-Timeframe Price Action Analysis
Multi-timeframe analysis works best when each chart has a defined role.
A practical three-timeframe model
| Timeframe role | Example | Main question |
| Context timeframe | Daily | Is the broader market trending or ranging? |
| Setup timeframe | Four-hour | Is price approaching a meaningful area? |
| Entry timeframe | One-hour | Has a specific trigger and invalidation formed? |
A shorter-term trader might use four-hour, one-hour, and 15-minute charts. The exact combination matters less than maintaining a stable relationship between them.
Top-down hypothetical scenario
Daily chart
- Bullish external structure
- Major support at 1.0800–1.0850
- Resistance near 1.1200
- Price currently at 1.0920
Four-hour chart
- Price has pulled back into 1.0880–1.0920
- Bearish momentum is weakening
- Several candles overlap near the zone
One-hour chart
- Price sweeps a prior low at 1.0885
- It closes back above 1.0900
- A bullish CHoCH forms above 1.0930
- A retest holds above 1.0915
The daily chart provides context, the four-hour chart defines the setup area, and the one-hour chart supplies the entry condition.
Handling timeframe conflict
A daily bullish trend can coexist with a one-hour bearish trend. This is not a contradiction; the one-hour decline may be a daily pullback.
Possible responses include:
- Trade only in the daily direction.
- Wait for the one-hour structure to realign.
- Trade the countertrend move with reduced expectations.
- Avoid the market until structure becomes clearer.
The dangerous response is switching timeframes repeatedly until one supports the trade already desired.

A Step-by-Step Price Action Trading Process
A repeatable process is more valuable than a long list of patterns.
Step 1: Classify the market
Choose one:
- Trend
- Range
- Compression
- Transition
- Unclear
“Unclear” is a valid classification and usually means no trade.
Step 2: Mark external structure
Identify the larger swing high and swing low controlling the chart.
Step 3: Mark relevant zones
Retain only areas that affected meaningful structure, such as:
- Prior range boundaries
- Previous breakout points
- Higher-timeframe support or resistance
- Clear swing highs or lows
- Areas of strong rejection
Step 4: Write conditional scenarios
Example:
- Bullish only if price holds above 1.0900 and closes above 1.0950.
- Bearish only if price accepts below 1.0880.
- No trade if price remains between 1.0900 and 1.0950.
This is more disciplined than predicting one direction.
Step 5: Wait for location
Do not enter solely because price is moving quickly. The setup should occur where the chart premise makes sense.
Step 6: Define the trigger
A trigger could be:
- Candle close beyond a swing
- Failed breakout and re-entry
- BOS after a pullback
- CHoCH followed by confirmation
- Rejection followed by displacement
- Breakout and successful retest
Step 7: Define invalidation
The stop belongs where the reason for entering is no longer valid.
If the trade depends on a swept low holding, a sustained break below that low may invalidate the setup.
Step 8: Calculate position size
The amount at risk should be determined before the order is placed.
Step 9: Define the exit
Possible methods include:
- Fixed target
- Next structural level
- Multiple of initial risk
- Partial exit plus trailing stop
- Exit on opposing structure
- Time-based exit
Step 10: Record the decision
Capture:
- Screenshot before entry
- Market condition
- Structural labels
- Entry and stop
- Target
- Estimated costs
- Outcome in risk units
- Whether rules were followed

Worked Forex Price Action Trade Example
The following example is entirely hypothetical. The prices, spread, commission, account size, and outcome are educational assumptions—not current market data or a trade recommendation.
Scenario
- Pair: EUR/USD
- Account currency: USD
- Account balance: $10,000
- Maximum account risk: 1%
- Higher-timeframe condition: Bullish
- Setup: Pullback into prior resistance turned support
- Hypothetical entry: 1.0900
- Structural stop: 1.0875
- Stop distance: 25 pips
- Target: 1.0950
- Target distance: 50 pips
- Gross risk-to-reward ratio: 1:2
Structural reasoning
- The four-hour chart has produced higher highs and higher lows.
- Price previously broke resistance at 1.0890.
- The pullback trades below 1.0890 but closes back above it.
- The one-hour chart breaks an internal lower high.
- The stop is placed below the sweep and structural low.
- The target is placed before the next major resistance area.
Basic risk calculation
Account risk:
$10,000 × 1% = $100
For EUR/USD in a USD-denominated account, one standard lot has an approximate pip value of $10 per pip.
Ignoring costs initially:
Position size = $100 ÷ (25 pips × $10 per pip)
Position size = 0.40 standard lots
At 0.40 lots:
- Pip value: approximately $4
- Loss at 25 pips: $100
- Gross gain at 50 pips: $200
Including assumed transaction costs
Assume, purely for illustration:
- Spread: 1.2 pips
- Round-turn commission: $7 per standard lot
At 0.40 lots:
- Spread cost:
1.2 × $4 = $4.80 - Commission:
0.40 × $7 = $2.80 - Total assumed cost:
$7.60
The trade would risk approximately $107.60 rather than the intended $100 if the position remained 0.40 lots.
To cap total planned risk closer to $100:
Position size = $100 ÷ [(25 × $10) + (1.2 × $10) + $7]
Position size = $100 ÷ $269
Position size ≈ 0.37 lots
Outcome table at 0.37 lots
| Outcome | Price movement | Approximate gross P/L | Assumed costs | Approximate net P/L |
| Stop loss | -25 pips | -$92.50 | -$7.03 | -$99.53 |
| Target | +50 pips | +$185.00 | -$7.03 | +$177.97 |
| Exit at +25 pips | +25 pips | +$92.50 | -$7.03 | +$85.47 |
| Exit at break-even price | 0 pips | $0 | -$7.03 | -$7.03 |
The gross trade appears to offer 2R, but its net reward is approximately:
$177.97 ÷ $99.53 ≈ 1.79R
The approximate break-even win rate becomes:
Break-even rate = Average loss ÷ (Average win + Average loss)
$99.53 ÷ ($177.97 + $99.53) ≈ 35.9%
Without costs, a 1:2 profile has a theoretical break-even win rate of 33.3%. Costs raise the required rate.
This example does not prove that the setup has positive expectancy. That requires a sufficient sample of consistently executed trades.

Stop-Loss Placement and Risk Management
Risk management does not turn a weak setup into a strong one, but it limits how much one incorrect decision can damage the account.
Structural stops versus arbitrary stops
A structural stop is located beyond the price that invalidates the trade idea.
An arbitrary stop is selected because it is convenient, such as exactly 10 or 20 pips, even when the chart requires more or less room.
| Stop method | Strength | Risk |
| Beyond structural invalidation | Connected to trade premise | May require smaller position |
| Fixed pip distance | Easy to calculate | Ignores volatility and structure |
| Volatility-based | Adjusts to market movement | May not align with invalidation |
| Time-based | Useful when setup should move quickly | Can exit before structure fails |
| Mental stop | Flexible | High risk of hesitation and loss expansion |
Position-sizing formula
For pairs where pip value is already known:
Position size = Monetary risk ÷ (Stop distance × Pip value per lot)
The pip value must match:
- Currency pair
- Account currency
- Position size
- Current conversion rate where relevant
A calculator supplied by a regulated broker or trading platform may help, but the trader should understand the underlying calculation.
Correlated exposure
Three trades can create one concentrated currency position.
For example:
- Long EUR/USD
- Long GBP/USD
- Short USD/CHF
All three may express broad US-dollar weakness. Risking 1% on each does not necessarily create three independent 1% risks.
A correlation-aware plan may cap total theme exposure rather than evaluate each ticket in isolation.
Leverage and execution risk
Leverage increases exposure relative to deposited margin. The CFTC warns that margin trading amplifies gains and losses and that, depending on the account and applicable protections, traders may be liable for losses beyond the initial deposit. Its advisory uses a 2% margin example in which $2,000 controls a $100,000 position.
Rules differ materially by jurisdiction and product. For example, the UK Financial Conduct Authority’s July 2026 handbook requires firms marketing leveraged CFDs, spread bets, or rolling spot Forex to display a provider-specific percentage of retail accounts that lose money. The percentage is calculated by the provider; there is no single universal 2026 loss rate.
Risk limits are plans, not fill guarantees. Fast movement, gaps, insufficient liquidity, and slippage can produce a different execution price.

When Price Action Signals Fail
A setup can be logically defined and still lose. Failure does not automatically mean that the analysis was careless.
Common failure causes
| Failure | Why it happens | Corrective action |
| Minor swing labeled as major structure | Trader focuses too closely on noise | Review the higher timeframe and require structural consequence |
| CHoCH entered as immediate reversal | Early warning is mistaken for confirmation | Wait for follow-through, retest, or additional break |
| BOS entered directly into resistance | Continuation label overrides location | Measure available space before entry |
| Range midpoint trade | No clear directional advantage | Wait near a boundary or for confirmed acceptance outside |
| Wick treated as guaranteed rejection | No follow-through appears | Require a close or subsequent structure |
| Stop placed too tightly | Position size or reward target dictates the stop | Place stop from invalidation, then size the position |
| News volatility ignored | Spread and execution conditions change rapidly | Check scheduled events and define a news-risk rule |
| Hindsight labeling | Swing rules change after the outcome | Mark charts from left to right and preserve screenshots |
Broker feeds and “pure” price
The FX market is not one centralized exchange with one universal retail candlestick. BIS research describes FX as a decentralized and fragmented OTC market using multiple execution methods and venues.
Retail charts can differ because of:
- Broker liquidity sources
- Bid, ask, or midpoint construction
- Spread differences
- Server time
- Daily candle boundaries
- Quote filtering
- Temporary data gaps
The CFTC notes that an off-exchange retail customer connects to the dealer rather than a live centralized exchange, and that the dealer controls the information shown on its platform, including prices. It recommends comparing prices with independent sources.
A bullish wick may therefore be slightly longer on one feed than another. Traders should test and execute from a consistent data source, and they should not build a strategy whose validity depends on a fraction-of-a-pip pattern difference.

How to Test a Price Action Strategy
Price action becomes testable only when visual ideas are translated into rules.
“Buy a strong rejection candle near support” is too vague.
A more testable definition might be:
- Pair: EUR/USD
- Timeframe: One hour
- Context: Daily bullish structure
- Location: Retest of a prior four-hour breakout zone
- Trigger: One-hour close above the last internal lower high
- Stop: Five pips below the structural low
- Target: Two times initial risk or next daily resistance, whichever comes first
- No trade: Within 30 minutes of a specified high-impact event
- Maximum spread: Defined in advance
The numerical thresholds are strategy design choices, not universal rules.
Record more than win rate
A journal should include:
| Metric | Why it matters |
| Win rate | Percentage of profitable trades |
| Average win | Typical gain in currency or R |
| Average loss | Typical loss in currency or R |
| Expectancy | Average result per trade |
| Maximum drawdown | Largest peak-to-trough decline |
| Maximum losing streak | Helps estimate psychological and capital pressure |
| Transaction cost | Determines whether a small theoretical edge survives |
| Rule adherence | Separates strategy performance from execution errors |
| Market condition | Shows where the setup performs or fails |
Expectancy example
Assume a hypothetical test produces:
- Win rate: 45%
- Average win: 1.70R
- Loss rate: 55%
- Average loss: 1.00R
Expectancy = (Win rate × Average win) - (Loss rate × Average loss)
Expectancy = (0.45 × 1.70R) - (0.55 × 1.00R)
Expectancy = 0.765R - 0.55R
Expectancy = 0.215R per trade
This result is meaningful only if:
- Costs are included.
- Rules were applied consistently.
- The sample covers more than one market condition.
- The trader did not remove losing trades retrospectively.
- The testing process avoided using future chart information.
A practical starting sample is 100 occurrences, but 100 trades do not guarantee statistical reliability. More observations across trends, ranges, quiet periods, and volatile periods provide a better view of robustness.
Backtesting and forward testing
Backtesting applies rules to historical data. It is faster but vulnerable to hindsight bias.
Forward testing applies rules to new market data as it appears. It is slower but more accurately tests whether decisions can be made without knowing the outcome.
A sensible process uses both.

Advantages and Limitations of Price Action Trading
Potential advantages
- It can be applied across currency pairs and timeframes.
- It keeps attention on price, location, and invalidation.
- It can adapt to trends, ranges, and transitions.
- It reduces dependence on optimized indicator settings.
- It integrates naturally with risk-to-reward planning.
- It helps traders explain why a setup is valid or invalid.
Important limitations
- Swing selection can be subjective.
- Structural labels vary across frameworks.
- Patterns are easy to identify after the outcome.
- Different broker feeds may produce different candles.
- Price does not reveal every participant’s motive.
- A visually convincing setup may have negative expectancy.
- Discretion can lead to inconsistent execution.
- Transaction costs can eliminate small theoretical advantages.
Who may prefer price action?
Price action may suit traders who:
- Can follow a structured discretionary process
- Are willing to review charts and maintain records
- Accept that uncertainty cannot be removed
- Prefer context-based decisions over automatic signals
- Can wait for price to reach predefined areas
A highly systematic trader may prefer rules that can be coded and tested with minimal interpretation. The two approaches can also be combined: market structure can define context while mechanical rules control entries and risk.
Price Action Trading Checklist
Use this checklist before placing a trade.
Market context
- Have I classified the market as trend, range, compression, transition, or unclear?
- Have I marked external and internal structure separately?
- Is the higher timeframe aligned with or opposed to the setup?
- Is price at a meaningful area rather than the middle of a range?
Setup quality
- What exactly is the setup?
- What price behavior must occur before entry?
- Am I labeling a meaningful swing or minor noise?
- Is this BOS, CHoCH, a sweep, or simply an unconfirmed penetration?
- Is there enough room before the next opposing zone?
Risk
- Where is the structural invalidation point?
- How many pips separate entry and stop?
- What is the correct position size?
- Have spread, commission, and possible slippage been considered?
- Do correlated positions increase total exposure?
- Is a scheduled event likely to affect execution conditions?
Execution
- Will the order be market, limit, stop, or conditional?
- What is the maximum acceptable spread?
- Is the target defined before entry?
- What happens if price stalls?
- What happens if the order is filled at a worse price?
Review
- Did I follow the documented rules?
- Was the market condition correctly classified?
- Did I interfere with the stop or target?
- Was the result caused by normal strategy variance or an execution error?
- Has the trade been recorded in R and currency terms?
Frequently Asked Questions
Yes. A trader can make decisions using only candles, swing structure, support and resistance, momentum, and volatility. However, “without indicators” is not automatically better. A carefully selected indicator may serve as a volatility measure, trend filter, or testing variable. The important requirement is that every tool has a defined purpose and does not replace risk management.
Under the framework used in this article, BOS is a structural break in the direction of the established trend, while CHoCH is the first meaningful break against that trend. BOS suggests continuation evidence; CHoCH warns of a possible transition. Neither guarantees the next price movement, and definitions may differ among traders.
There is no universal best timeframe. Lower timeframes produce more signals but are more sensitive to spreads, noise, and rapid decision-making. Higher timeframes produce fewer signals and generally require wider stops and longer holding periods. The best timeframe is one that fits the trader’s availability, costs, risk tolerance, and tested strategy.
A practical starting point is at least 100 occurrences under consistent rules. This is a workflow guideline, not proof of reliability. A stronger evaluation uses more observations across multiple market conditions and then validates the setup through forward testing.
Price action trading can produce profitable or unprofitable results. Profitability depends on whether the complete strategy has positive expectancy after spreads, commissions, slippage, financing costs, and execution errors. A chart pattern alone does not create an edge, and no price action setup can guarantee profit.
Conclusion: Read Price as Evidence, Not Prediction
Price action trading is most useful when it is treated as a structured evidence-gathering process.
Candles show how price behaved during a period. Swings organize that behavior into structure. BOS can show continuation, while CHoCH can warn of transition. Support, resistance, and liquidity areas add location. None of these elements predicts the market with certainty.
A practical starting process is:
- Select one currency pair and one stable timeframe combination.
- Define one setup, including context, trigger, invalidation, and exit.
- Test it consistently before risking meaningful capital.
The objective is not to become certain about the next candle. It is to make repeatable decisions while keeping the cost of being wrong controlled.
CTA: Build a one-page price action checklist, mark charts from left to right, and record your next 100 qualified setups before judging whether the strategy has an edge.
Financial Risk Disclaimer
Forex, contracts for difference, rolling spot Forex, spread betting, futures, and other leveraged products involve substantial risk and are not appropriate for every trader. Leverage can amplify both gains and losses. Depending on the product, broker, account agreement, and jurisdiction, losses may exceed the amount initially deposited.
All prices, account balances, spread assumptions, commissions, position sizes, and trade outcomes in this article are hypothetical educational examples. They are not live market quotations, personalized recommendations, investment advice, legal advice, or tax advice.
The CFTC has reported that approximately two-thirds of customers at registered US OTC Forex dealers lost money during the period from Q2 2021 through Q1 2022 after costs. This is historical US data, not a universal or current 2026 loss rate. Readers should verify the latest provider-specific risk disclosure and applicable regulatory protections before opening an account.
Past price behavior, backtested results, and hypothetical performance do not guarantee future results. Stop-loss orders may be affected by slippage, gaps, liquidity, spreads, and execution conditions. Verify broker authorization, margin terms, fees, withdrawal procedures, negative-balance protection, and client-money arrangements in your own jurisdiction.