

 PIPAVO Team
Learn how OTE, premium and discount zones, CHoCH, BOS, liquidity and risk sizing work in Forex, with practical examples and clear limitations.
In this article
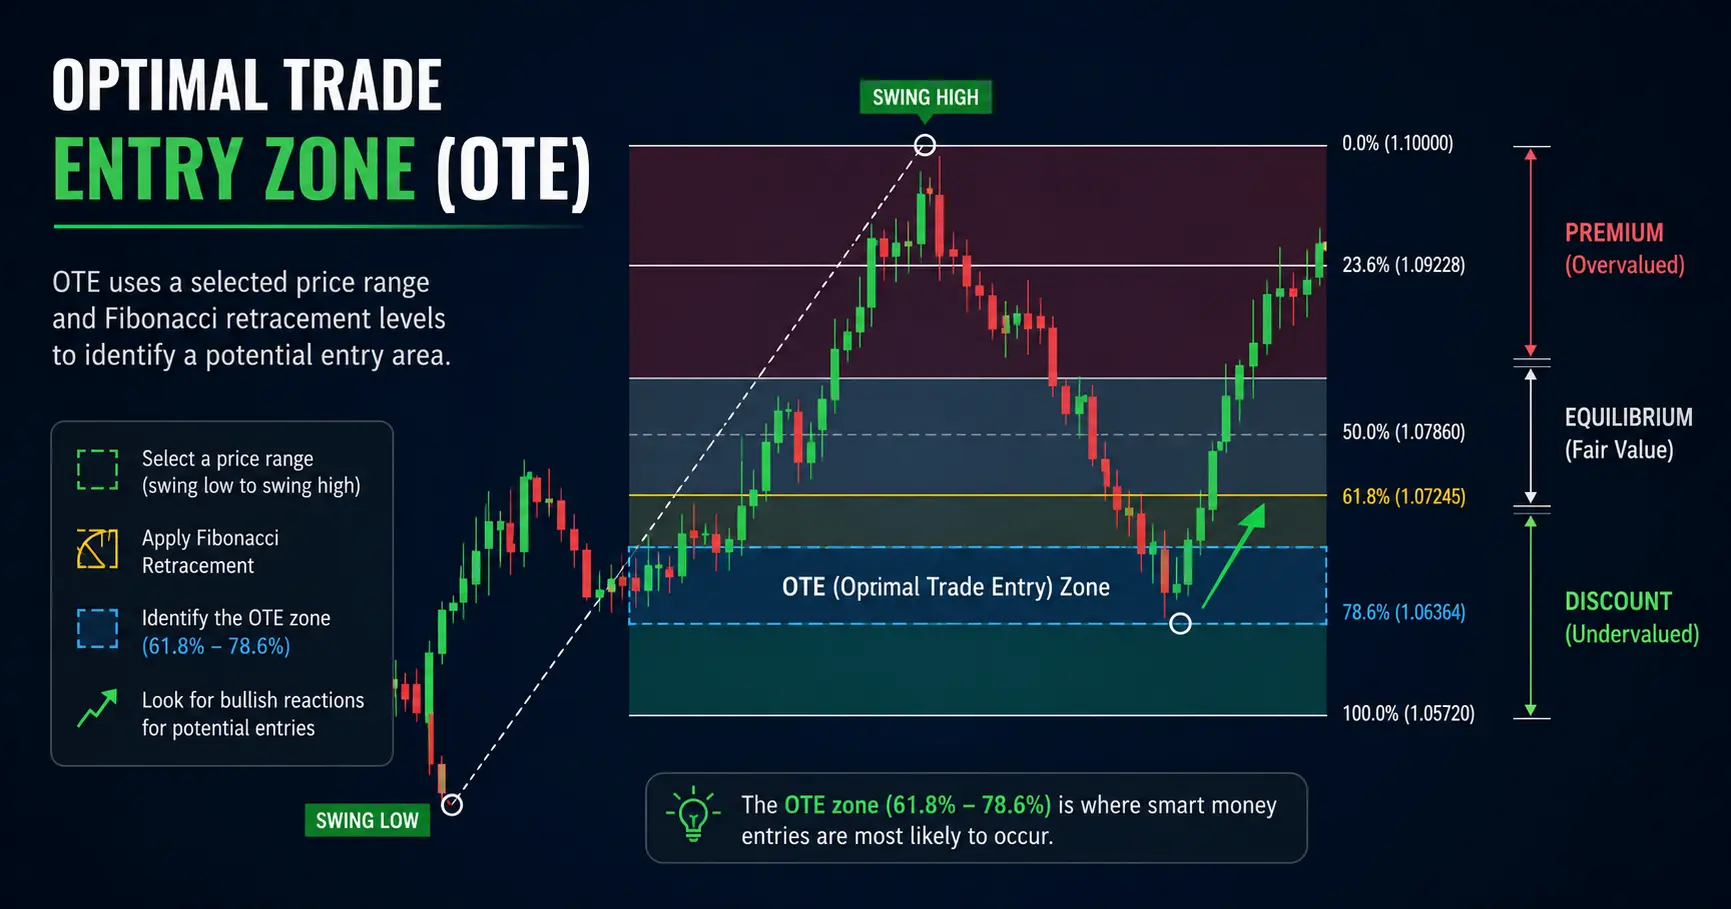
Optimal Trade Entry, or OTE, is a Fibonacci-based framework for identifying a potential entry area during a market pullback. Traders typically combine the 62%–79% retracement zone with premium and discount pricing, market structure, liquidity and risk management. OTE is not an automatic buy or sell signal, however, and no Fibonacci level can guarantee that price will reverse.
What Is Optimal Trade Entry in Forex Trading?
Optimal Trade Entry is commonly associated with the Inner Circle Trader, or ICT, methodology. Its central idea is straightforward: rather than chasing price after a strong directional move, a trader waits for a retracement toward a more favorable location.
ICT-derived educational materials commonly define the broader OTE zone as the area between the 62% and 79% Fibonacci retracement levels, with particular emphasis on 70.5%. These are conventions within the methodology, not regulatory standards or independently proven reversal probabilities.
An OTE setup normally requires three components:
- A clearly defined directional price swing.
- A retracement into the 62%–79% area.
- A reason to expect the original direction to resume.
The third component is essential. Price reaching 70.5% does not prove that buyers or sellers will take control.
The Main OTE Fibonacci Levels
| Fibonacci level | Typical interpretation |
|---|---|
| 0% and 100% | Boundaries of the selected dealing range |
| 50% | Equilibrium, or the midpoint of the range |
| 62% | Beginning of the wider OTE zone |
| 70.5% | Commonly emphasized OTE refinement level |
| 79% | Deep boundary of the wider OTE zone |
The exact display orientation depends on the charting platform and the direction in which the Fibonacci tool is drawn. What matters is the percentage of the original impulse that price has retraced.
Worked Bullish OTE Calculation
Assume EUR/USD rises from a hypothetical swing low of 1.0800 to a swing high of 1.1000.
The total range is:
1.1000 − 1.0800 = 0.0200, or 200 pips
For a bullish setup, retracement prices are calculated down from the swing high:
| Level | Calculation | Price |
| 50% | 1.1000 − (0.0200 × 0.50) | 1.0900 |
| 62% | 1.1000 − (0.0200 × 0.62) | 1.0876 |
| 70.5% | 1.1000 − (0.0200 × 0.705) | 1.0859 |
| 79% | 1.1000 − (0.0200 × 0.79) | 1.0842 |
The resulting bullish OTE area is approximately 1.0842–1.0876.
This example is hypothetical. It demonstrates the calculation only and is not a live EUR/USD trading recommendation.

Premium, Discount and Equilibrium Explained
Premium and discount zones divide a selected price range into two halves:
- Prices above the 50% midpoint are in premium.
- Prices below the 50% midpoint are in discount.
- The 50% level is equilibrium.
These labels describe relative location. They do not establish fundamental value.
A currency pair in discount is not necessarily undervalued, and a pair in premium is not necessarily overvalued. The classification changes whenever the trader changes the swing high, swing low or timeframe.
How Traders Apply the Zones
In a bullish framework, traders generally prefer to investigate long setups below equilibrium, where price is in discount relative to the selected range.
In a bearish framework, traders generally prefer to investigate short setups above equilibrium, where price is in premium.
| Zone | Location in the range | Typical bullish interpretation | Typical bearish interpretation |
| Premium | Above 50% | Less attractive for a new long | Potential short location |
| Equilibrium | At 50% | Midpoint; limited location advantage | Midpoint; limited location advantage |
| Discount | Below 50% | Potential long location | Less attractive for a new short |
Why the Selected Range Matters
Suppose EUR/USD is trading at 1.0900.
- Within a daily range of 1.0600–1.1200, equilibrium is 1.0900. Price is exactly at equilibrium.
- Within an hourly bullish range of 1.0800–1.1000, price is also at equilibrium.
- Within a 15-minute bearish range of 1.0950–1.0850, price is below its 1.0900 midpoint and therefore in discount.
The same market price can occupy different zones across different structural ranges. Traders must identify which range controls the analysis before applying premium or discount labels.
OTE Zone Versus Premium/Discount Zones
| Concept | Definition | Main purpose |
| Premium/discount | The two halves of a selected range | Establish relative price location |
| Equilibrium | The 50% midpoint | Separate premium from discount |
| OTE | Usually the 62%–79% retracement area | Identify a deeper pullback location |
| 70.5% level | A refinement inside OTE | Provide a specific reference price |
| Golden pocket | A loosely defined Fibonacci term | Varies considerably between trading communities |

How to Draw a Valid Dealing Range
A dealing range is the price interval between a meaningful swing low and swing high. The quality of an OTE calculation depends heavily on these anchors.
Drawing Fibonacci across every visible fluctuation produces many overlapping zones and encourages hindsight-based analysis.
Step-by-Step Range Selection
- Establish the higher-timeframe context.
Determine whether the broader market is trending, ranging or transitioning. - Identify meaningful external boundaries.
Mark prominent highs and lows that contain the current price action. - Find the impulse that changed or extended structure.
Look for a directional movement that closed beyond a relevant swing. - Mark the origin of that impulse.
The origin is often more useful than a minor pivot formed inside the move. - Mark the completed swing.
Use the high or low reached before the pullback began. - Check whether the range remains valid.
If price fully breaches the structural origin, the original premise may no longer apply. - Redraw only when structure materially changes.
A meaningful new high or low may require a new range; every wick does not.
External Versus Internal Structure
External structure represents the larger swing boundaries containing the market. Internal structure describes the smaller movements inside that range.
A trader might use:
- The daily chart to determine external direction.
- The one-hour chart to identify the relevant pullback.
- The five-minute chart to refine execution.
Problems arise when a five-minute internal break is treated as if it has reversed the daily trend.
Correct and Incorrect Anchor Selection
| Common error | Why it happens | Corrective action |
| Using the most recent tiny swing | Recency bias | Use the impulse connected to meaningful structure |
| Ignoring the higher timeframe | Focus on entry precision | Mark external direction before execution structure |
| Redrawing after every candle | Desire to keep the setup valid | Define objective redraw conditions in advance |
| Anchoring to a random wick | The wick visually improves the entry | Use consistent wick-or-close rules |
| Selecting the range after seeing the outcome | Hindsight bias | Save a screenshot before price reaches the zone |

How to Draw Bullish and Bearish OTE Zones
Bullish OTE Process
For a bullish setup:
- Identify a meaningful low.
- Confirm that price moved upward with sufficient strength to create a relevant swing high.
- Draw the Fibonacci tool from the swing low to the swing high.
- Mark the 50% equilibrium level.
- Mark the 62%–79% retracement area below equilibrium.
- Wait for price to retrace into the area.
- Require the confirmation conditions defined in the trading plan.
- Place invalidation below a structurally meaningful level.
Using the earlier 1.0800–1.1000 example, the OTE zone is 1.0842–1.0876.
Bearish OTE Process
Assume GBP/USD falls from a hypothetical swing high of 1.2800 to a swing low of 1.2600.
The range is 200 pips. The retracement is calculated upward from the low:
| Level | Calculation | Price |
| 50% | 1.2600 + (0.0200 × 0.50) | 1.2700 |
| 62% | 1.2600 + (0.0200 × 0.62) | 1.2724 |
| 70.5% | 1.2600 + (0.0200 × 0.705) | 1.2741 |
| 79% | 1.2600 + (0.0200 × 0.79) | 1.2758 |
The bearish OTE zone is approximately 1.2724–1.2758, which lies in the premium half of the selected range.
Check the Fibonacci Direction
The visual orientation differs between platforms, so verify the result logically:
- A bullish OTE must be below the midpoint of the bullish range.
- A bearish OTE must be above the midpoint of the bearish range.
- A 79% retracement must be deeper than a 62% retracement.

CHoCH, BOS and Market-Structure Transitions
Market structure gives context to an OTE zone. Two common terms are Break of Structure, or BOS, and Change of Character, or CHoCH.
Within many ICT and Smart Money Concepts frameworks:
- A BOS is a break in the direction of the prevailing structure.
- A CHoCH is an initial break against the prevailing structure.
These definitions are not standardized across all traders. Some require a candle-body close beyond the swing, while others count a wick. Some traders use CHoCH and Market Structure Shift interchangeably, while others treat them as different stages.
Break of Structure
In a bullish sequence of higher highs and higher lows, a close above a meaningful prior high may be labeled bullish BOS.
In a bearish sequence of lower lows and lower highs, a close below a meaningful prior low may be labeled bearish BOS.
A BOS indicates what the framework interprets as continuation. It does not ensure that continuation will occur.
Change of Character
In an uptrend, a break below a relevant higher low may be labeled bearish CHoCH.
In a downtrend, a break above a relevant lower high may be labeled bullish CHoCH.
CHoCH is best treated as an early warning that the previous sequence may be weakening—not as confirmation that a full reversal has occurred. ICT-focused sources themselves acknowledge that definitions depend on swing selection and that a CHoCH can fail.
CHoCH Versus BOS
| Feature | CHoCH | BOS |
| Direction | Against the existing structural sequence | In the direction of the existing structural sequence |
| Typical interpretation | Possible transition warning | Possible continuation confirmation |
| Relative timing | Often appears earlier | Often appears after direction is established |
| Main limitation | Many early warnings fail | Breakouts can also fail |
| Timeframe issue | May affect only internal structure | May still be internal to a larger opposing trend |
Why Traders Disagree About the Same Chart
Consider a market that is bearish on the daily chart but rallying on the five-minute chart.
A break above a five-minute lower high might be:
- A bullish CHoCH relative to the five-minute decline.
- A bullish BOS relative to a newly formed micro uptrend.
- Merely an internal retracement within the daily bearish range.
None of these labels has meaning without the structural timeframe and swing-selection rule.
Practical Transition Sequence
A potential bullish transition may develop as follows:
- Price trades below a previous low.
- Price rapidly returns above that low.
- A lower-timeframe lower high is broken.
- The break is labeled internal bullish CHoCH.
- Price forms a higher low.
- Price closes above a more significant high.
- That later break may be labeled bullish BOS.
- A retracement into discount creates a possible OTE setup.
The sequence remains probabilistic. Price can reverse again at any stage.

Liquidity and Its Role in OTE
In this context, liquidity generally refers to areas where many orders may be concentrated. Examples include protective stops above a visible high or below a visible low.
A liquidity sweep occurs when price moves beyond an obvious level and then returns. This does not prove deliberate institutional manipulation. It is simply an observable price event around a location where orders may be clustered.
Common Liquidity Locations
| Location | Possible order concentration |
| Equal highs | Buy stops and short-position stops |
| Equal lows | Sell stops and long-position stops |
| Previous-day high | Breakout orders and short stops |
| Previous-day low | Breakdown orders and long stops |
| Session high or low | Intraday stops and breakout orders |
| Consolidation boundary | Orders from range traders |
| Major swing point | Stops and pending breakout entries |
Internal and External Liquidity
Internal liquidity lies inside the selected dealing range. It may include minor highs, lows or imbalances formed during the pullback.
External liquidity lies beyond the main range boundaries. It may function as a larger target or invalidation reference.
Practical Liquidity-to-OTE Scenario
Assume EUR/USD trades beneath the previous day’s low but closes back above it. A bullish candle then closes above a lower-timeframe swing high.
A trader could interpret this sequence as:
- Sell-side liquidity taken below the previous low.
- Bullish displacement away from the low.
- Internal bullish CHoCH.
- A new bullish dealing range.
- A pullback toward its 62%–79% discount zone.
- A possible long entry only if the trader’s confirmation and risk rules remain satisfied.
The liquidity event provides context. It does not eliminate the possibility of a genuine downside breakout.

Confluence Factors for an OTE Setup
OTE is more useful as one part of a decision framework than as a standalone level.
Potential confluence factors include:
- Higher-timeframe directional alignment
- A liquidity sweep
- Strong directional displacement
- A relevant CHoCH or BOS
- An overlapping fair value gap
- A clearly defined invalidation point
- Sufficient potential reward relative to risk
- Acceptable spread and execution conditions
A fair value gap, in ICT terminology, is a three-candle imbalance where part of the first and third candle ranges do not overlap. It is a chart pattern, not proof that unfilled institutional orders exist there.
Example OTE Scorecard
| Condition | Score |
| Higher-timeframe direction supports the trade | 1 |
| Relevant liquidity was taken | 1 |
| Displacement followed | 1 |
| Structure changed or continued as required | 1 |
| OTE overlaps a planned area of interest | 1 |
| Invalidation is objective | 1 |
| Projected reward meets the tested requirement | 1 |
A trader might require five out of seven conditions before considering an entry. This scorecard is an organizational tool, not a validated probability model. It must be tested as a complete rule set.
Three Ways to Enter an OTE Setup
1. Limit Order
A limit order is placed inside the OTE zone before confirmation occurs.
Advantage: It may achieve a better price and smaller stop distance.
Disadvantage: Price can continue through the zone without reacting.
2. Confirmation Entry
The trader waits for evidence such as:
- A lower-timeframe CHoCH
- Displacement away from the zone
- A micro BOS
- A rejection followed by a retest
Advantage: The market shows some response before entry.
Disadvantage: The entry is usually worse, the stop may be wider and the trade may be missed.
3. Scale-In Entry
The trader divides one planned position across several prices, such as 62%, 70.5% and 79%.
The critical rule is that the combined maximum loss must remain within the original account-risk limit. Three entries do not justify three times the risk.
| Method | Price quality | Confirmation | Missed-trade risk | Complexity |
| Limit order | Potentially best | Low | Low | Low |
| Confirmation | Usually less favorable | Higher | High | Medium |
| Scale-in | Averaged | Variable | Medium | High |
One Range, Three Entry Plans
For the hypothetical bullish range from 1.0800 to 1.1000:
- Limit trader enters at 1.0859.
- Confirmation trader waits for a five-minute structural break and enters at 1.0880.
- Scale-in trader divides the position between 1.0876, 1.0859 and 1.0842.
The method that looks best after the chart is complete is not necessarily the method that performs best across a large sample.

Stop-Loss Placement and Invalidation
A stop-loss should represent the point at which the original trade thesis is no longer acceptable. It should not be selected only because it creates an attractive reward-to-risk ratio.
Common Stop Approaches
| Stop approach | Advantage | Limitation |
| Just beyond 79% | Small nominal distance | May be hit during a normal deep retracement |
| Beyond the impulse origin | Strong structural logic | Requires smaller position size |
| Beyond external liquidity | Allows more price movement | Can produce a wide stop |
| Volatility-based stop | Adjusts to market movement | May not align with structural invalidation |
Tight Stop Versus Structural Stop
Assume a hypothetical long entry at 1.0860.
Tight stop
- Stop: 1.0835
- Distance: 25 pips
Structural stop
- Stop: 1.0810
- Distance: 50 pips
With a $100 risk limit and an approximate EUR/USD pip value of $10 per standard lot:
- Tight-stop size:
100 ÷ (25 × 10) = 0.40 lots - Structural-stop size:
100 ÷ (50 × 10) = 0.20 lots
Both plans risk approximately $100 before trading costs. The tighter stop does not reduce account risk when position size is adjusted correctly; it increases exposure per pip.
Conditions That May Invalidate the Setup
- Price closes beyond the structural origin.
- The expected displacement does not appear.
- Opposing external structure breaks first.
- Higher-timeframe direction materially changes.
- Spread or slippage makes the planned risk unreliable.
- The original dealing range was incorrectly selected.
Never widen a stop simply to avoid recording a loss. Changing the invalidation point after entry also changes the strategy being tested.
Position Sizing and Risk-to-Reward Calculations
Leverage determines how much market exposure a trader can control, but risk is determined by the position size and stop distance.
Rules differ by jurisdiction. For example, NFA guidance for US-regulated retail Forex dealers lists a 2% security deposit for pairs such as EUR/USD and 5% for pairs such as USD/MXN, broadly corresponding to 50:1 and 20:1 maximum notional leverage. These are US-specific requirements, not global standards.
Step 1: Calculate Account Risk
Account balance × risk percentage = maximum planned loss
For a $10,000 account risking 1%:
$10,000 × 0.01 = $100
Step 2: Calculate Stop Distance
For a long position:
Entry price − stop price = stop distance
For a short position:
Stop price − entry price = stop distance
The trader should also consider spread, commission and possible slippage.
Step 3: Calculate Position Size
For a pair where one standard lot is approximately $10 per pip in the account currency:
Position size = risk amount ÷ (stop distance × pip value per standard lot)
Actual pip value depends on the currency pair, account currency and price. A broker’s position-size calculator should be checked before execution.
Bullish OTE Example
Assumptions:
- Account: $10,000
- Risk: 1%, or $100
- EUR/USD entry: 1.0859
- Stop: 1.0829
- Stop distance: 30 pips
- Approximate pip value: $10 per standard lot
- Target: 1.0959
- Target distance: 100 pips
Position size:
$100 ÷ (30 × $10) = 0.333 lots
Rounding down to 0.33 lots:
- Approximate loss at stop:
30 × $3.30 = $99 - Approximate gain at target:
100 × $3.30 = $330 - Planned reward-to-risk ratio:
330 ÷ 99 = 3.33:1
Trading costs would reduce the realized result.
Bearish OTE Example
Assumptions:
- Account: $15,000
- Risk: 0.75%, or $112.50
- GBP/USD entry: 1.2741
- Stop: 1.2781
- Stop distance: 40 pips
- Position size: 0.28 lots
- Target: 1.2641
- Target distance: 100 pips
Results before costs:
- Approximate risk:
40 × $2.80 = $112 - Approximate reward:
100 × $2.80 = $280 - Planned reward-to-risk ratio:
280 ÷ 112 = 2.5:1
Both examples are hypothetical.
Entry Depth Comparison
Using the bullish 1.0800–1.1000 range, assume:
- Structural stop: 1.0790
- Target: 1.1000
| Entry | Stop distance | Target distance | Theoretical R |
| 62% at 1.0876 | 86 pips | 124 pips | 1.44:1 |
| 70.5% at 1.0859 | 69 pips | 141 pips | 2.04:1 |
| 79% at 1.0842 | 52 pips | 158 pips | 3.04:1 |
The deeper entry offers a better theoretical ratio, but price may not reach it. A deep retracement may also indicate that the original impulse is weakening.

How to Select Profit Targets
A logical target should correspond to market structure, liquidity or a tested R-multiple rule.
Internal Liquidity Target
An internal high or low may provide a closer target. It offers less potential reward but may be more realistic than expecting price to reach the opposite external boundary.
External Liquidity Target
A prior major high, low or range boundary may provide a larger objective. The trade must survive more intervening structure to reach it.
Fixed R-Multiple Target
An R-multiple measures the result relative to initial risk:
- A $100 loss is −1R.
- A $200 gain is +2R.
- A $50 gain is +0.5R.
A large target is not automatically superior. Profitability depends on both average reward and the frequency with which targets are reached.
Partial Profit Example
Assume the position is managed as follows:
- 50% closed at 1.5R
- 25% closed at 2.5R
- 25% closed at 4R
Blended result:
(0.50 × 1.5) + (0.25 × 2.5) + (0.25 × 4)
0.75 + 0.625 + 1.00 = 2.375R
Partial exits may reduce the effect of a later reversal, but they can also reduce gains when price reaches the final target.
Moving the Stop to Break-Even
A break-even rule can protect capital after favorable movement, but moving the stop too early may repeatedly close trades before the expected expansion.
Test objective rules such as:
- Move to break-even only after a new structural high or low.
- Move after a specific R-multiple.
- Do not move the stop unless the original invalidation changes.
Two Complete OTE Case Studies
Bullish Case Study
This scenario is hypothetical.
Context
- Four-hour structure is bullish.
- Price approaches the previous day’s low.
- The low is briefly breached.
- Price closes back above it and breaks a 15-minute lower high.
Range
- Swing low: 1.0800
- Swing high: 1.1000
- OTE: 1.0842–1.0876
- Preferred reference: 1.0859
Execution
- Account: $10,000
- Risk: $100
- Entry: 1.0859
- Stop: 1.0829
- Size: 0.33 lots
- First target: 1.0900
- Second target: 1.0959
- External target: 1.1000
Decision rules
The order is canceled if price closes below the structural origin before entry. If the lower-timeframe bullish response never develops, a confirmation-based trader does not enter.
Alternative outcomes
- Price rallies without reaching 1.0876: the trade is missed.
- Price reaches 1.0859 but continues through the stop: −1R.
- Price reaches the first target and reverses: result depends on partial-exit rules.
- Price reaches 1.1000: the deeper entry produces a larger R-multiple.
Failed Bearish Case Study
Initial thesis
- Price is in premium within a one-hour bearish range.
- A previous intraday high is swept.
- Price closes below a minor five-minute low.
- The trader labels this bearish CHoCH.
Plan
- Entry: 1.2741
- Stop: 1.2781
- Target: 1.2641
- Risk: $112
- Position: 0.28 lots
Failure
Price briefly falls, then closes above 1.2781. Reviewing the chart shows:
- The bearish range was internal to a bullish daily trend.
- The five-minute CHoCH broke only a minor low.
- No meaningful one-hour support was broken.
- The trader treated premium as a sell signal rather than relative location.
Corrective lesson
The proper response is to record the −1R loss, not widen the stop. Future tests should distinguish external and internal structure and define which swing must break before a bearish setup is valid.

Common OTE Trading Mistakes
| Mistake | Why it happens | Corrective action |
| Buying every discount zone | Discount is mistaken for value | Require direction, structure and invalidation |
| Selling every premium zone | Premium is mistaken for overvaluation | Treat it only as relative location |
| Drawing Fibonacci on every swing | Trader wants more setups | Use a documented swing hierarchy |
| Treating CHoCH as a guaranteed reversal | Early signals appear attractive | Require follow-through or broader confirmation |
| Ignoring trading costs | Backtest assumes perfect fills | Include spread, commission and slippage |
| Using excessive leverage | Small stop appears safe | Calculate size from fixed account risk |
| Widening the stop | Trader avoids accepting invalidation | Keep the original risk plan |
| Changing rules after losses | Recency and outcome bias | Review only after a predefined sample |
| Backtesting with future information | Historical charts make structure look obvious | Use bar replay and pre-entry screenshots |
When OTE May Be Less Useful
OTE is generally easier to define when price has produced a clear directional impulse followed by an orderly pullback.
It may be less useful in:
- Tight, directionless consolidation
- Highly overlapping price action
- Markets with no clear swing anchors
- Repeated tests of the same zone
- Thin trading periods
- Conditions with unusually wide spreads
- Sudden news-driven volatility
Market-Condition Comparison
| Condition | OTE suitability | Main issue |
| Clear trend and pullback | Relatively suitable for testing | Direction and range are easier to define |
| Post-breakout retracement | Potentially suitable | Breakout may fail |
| Tight consolidation | Poor | Excessive overlapping zones |
| Major news release | High execution risk | Slippage and spread expansion |
| Countertrend setup | More demanding | External structure remains opposed |
| Repeated zone test | Uncertain | Previous reaction may not repeat |
As of July 2026, traders should verify economic-release schedules and broker execution conditions directly before trading. Historical spreads or general session assumptions are not substitutes for live conditions.
How to Backtest an OTE Strategy
No credible win rate can be assigned to “OTE” without defining the entire strategy.
Two traders using the same 70.5% level may produce completely different results because they use different:
- Swing-selection rules
- Timeframes
- Confirmation requirements
- Stop placements
- Profit targets
- Trading sessions
- Cost assumptions
Step-by-Step Testing Protocol
- Select the currency pairs.
- Define the analysis and execution timeframes.
- Define external and internal structure.
- Specify whether breaks require a wick or candle close.
- Define the exact Fibonacci anchors.
- Select limit, confirmation or scale-in execution.
- Define stop placement.
- Define targets and trade management.
- Include spread, commission and slippage.
- Test across trending, ranging and volatile periods.
- Separate rule development from out-of-sample evaluation.
Metrics to Record
- Number of trades
- Win rate
- Average win in R
- Average loss in R
- Expectancy
- Profit factor
- Maximum drawdown
- Consecutive losses
- Average favorable excursion
- Average adverse excursion
- Missed-entry rate
- Rule violations
Expectancy Example
Assume a 100-trade hypothetical test produces:
- Win rate: 42%
- Loss rate: 58%
- Average win: 2.2R
- Average loss: 1R
Expectancy:
(0.42 × 2.2R) − (0.58 × 1R)
0.924R − 0.58R = 0.344R per trade
Gross profit factor:
(42 × 2.2R) ÷ (58 × 1R) = 1.59
This appears positive before considering execution costs and out-of-sample performance. It does not prove that OTE generally has an edge.
Sample OTE Journal
| Field | Example entry |
| Date | 2026-07-30 |
| Pair | EUR/USD |
| External bias | Bullish |
| Dealing range | 1.0800–1.1000 |
| Liquidity event | Previous low swept |
| Structural event | Internal bullish CHoCH |
| Entry model | Confirmation |
| OTE price | 1.0859 |
| Risk | 1% |
| Result | +2.0R |
| Rule followed? | Yes |
| Screenshot | Before and after entry |
The CFTC reports that approximately two out of three retail Forex traders at registered US dealers finish each quarter with losses. That statistic is not an OTE performance measure, but it illustrates why strategy claims should be tested rather than accepted from marketing.

OTE Versus Other Entry Methods
| Method | Entry logic | Main advantage | Main limitation |
| OTE | Deep 62%–79% retracement | Potentially favorable entry price | Swing selection is subjective |
| 50% retracement | Entry near equilibrium | More frequent fills | Less price improvement |
| Breakout and retest | Enter after a level breaks and retests | Visible confirmation | Retest may not occur |
| Support and resistance | Enter near horizontal reaction areas | Simple to visualize | Zones can be broad |
| Golden pocket | Fibonacci retracement cluster | Widely recognized | Definition varies by trader |
OTE is not inherently superior to these approaches. Its performance depends on the complete rules and the market conditions in which those rules are applied.
Practical OTE Trading Checklist
Context
- Is the higher-timeframe market trending or ranging?
- Which external high and low define the active range?
- Is price in premium, discount or equilibrium?
- Does the trade direction align with the selected structure?
Setup
- Was a meaningful liquidity level breached?
- Did displacement follow?
- Which exact swing was broken?
- Is the event a CHoCH, BOS or only internal noise?
- Does the OTE zone overlap another planned area?
Risk
- What exact price invalidates the thesis?
- How many pips are at risk?
- What is the maximum loss in dollars?
- Have spread and slippage been considered?
- Is the potential reward sufficient under the tested rules?
Execution
- Will the trade use a limit, confirmation or scale-in entry?
- What cancels an unfilled order?
- Where is the first target?
- Where is the final target?
- Under what condition will the stop be adjusted?
Review
- Was the original plan followed?
- Was the dealing range selected consistently?
- Was the result recorded in R?
- Were pre-entry and post-trade screenshots saved?
- Was the outcome caused by normal strategy variance or a rule violation?

Current Forex Market Context as of July 2026
The global Forex market is exceptionally large, but size does not make retail trading easy. The Bank for International Settlements reported average OTC Forex turnover of $9.6 trillion per day in April 2025, up 28% from its 2022 survey. The US dollar appeared on one side of 89.2% of all reported trades.
For a dated market reference, the European Central Bank published an EUR/USD reference rate of EUR 1 = USD 1.1380 on July 29, 2026. The ECB states that its reference rates are informational and are not intended as transaction prices.
These figures provide market context only. They do not validate OTE or indicate where EUR/USD will trade next.
Frequently Asked Questions
The wider OTE zone is commonly drawn between the 62% and 79% retracement levels. The 70.5% level is often highlighted as a refinement inside that zone. These percentages are conventions within ICT-derived trading education, not guaranteed reversal levels.
There is no universal evidence showing that 70.5% is always superior. A deeper entry can improve theoretical reward relative to risk, but it may reduce the likelihood of being filled and may occur when the original impulse is weakening. The comparison must be tested under a complete set of rules.
Yes. Price can be in discount relative to a daily dealing range while simultaneously being in premium relative to a smaller intraday range. Traders should state the timeframe and exact swing anchors whenever using these labels.
Not necessarily. Some traders place limit orders at OTE, while others require CHoCH, BOS or displacement on a lower timeframe. The important point is to define the confirmation rule before testing and apply it consistently.
The levels can be plotted on any chart, but that does not mean the approach performs equally across all pairs or timeframes. Spread, volatility, liquidity, session behavior and execution quality can materially change results.
A disciplined process is:
- Define the relevant dealing range.
- Establish whether price is in premium or discount.
- Identify the structural and liquidity context.
- Distinguish CHoCH from BOS within the chosen timeframe.
- Set invalidation before entry.
- Calculate position size from fixed account risk.
- Test the entire rule set across a meaningful sample.
Practise the method on historical charts or a demo account before considering live execution. Record every setup, including the trades that fail and the orders that are never filled.
Financial Risk Disclaimer
This material is provided for general educational and informational purposes only. It does not constitute investment advice, a personal recommendation, an offer, a solicitation or a guarantee of future performance.
Optimal Trade Entry, premium and discount zones, CHoCH, BOS, fair value gaps and liquidity concepts are discretionary technical-analysis frameworks. Their interpretation can vary between traders, platforms and timeframes. No Fibonacci level, chart pattern or structural label guarantees that price will reverse or continue.
All price scenarios and performance calculations in this article are hypothetical unless expressly identified as dated market data. Hypothetical results do not represent actual execution and may not fully account for spreads, commissions, slippage, liquidity, latency, rejected orders or emotional decision-making.
Leveraged Forex trading carries a high risk of loss. Depending on the product, broker and jurisdiction, losses may exceed the initial amount allocated to a position. Verify all leverage, margin, negative-balance protection and product rules with an appropriately regulated provider in your jurisdiction. Consider seeking advice from an independent, qualified financial professional before trading.