

 PIPAVO Team
Learn how Forex liquidity grabs work, how to distinguish sweeps from real breakouts, and how to trade them with structure and risk controls.
In this article
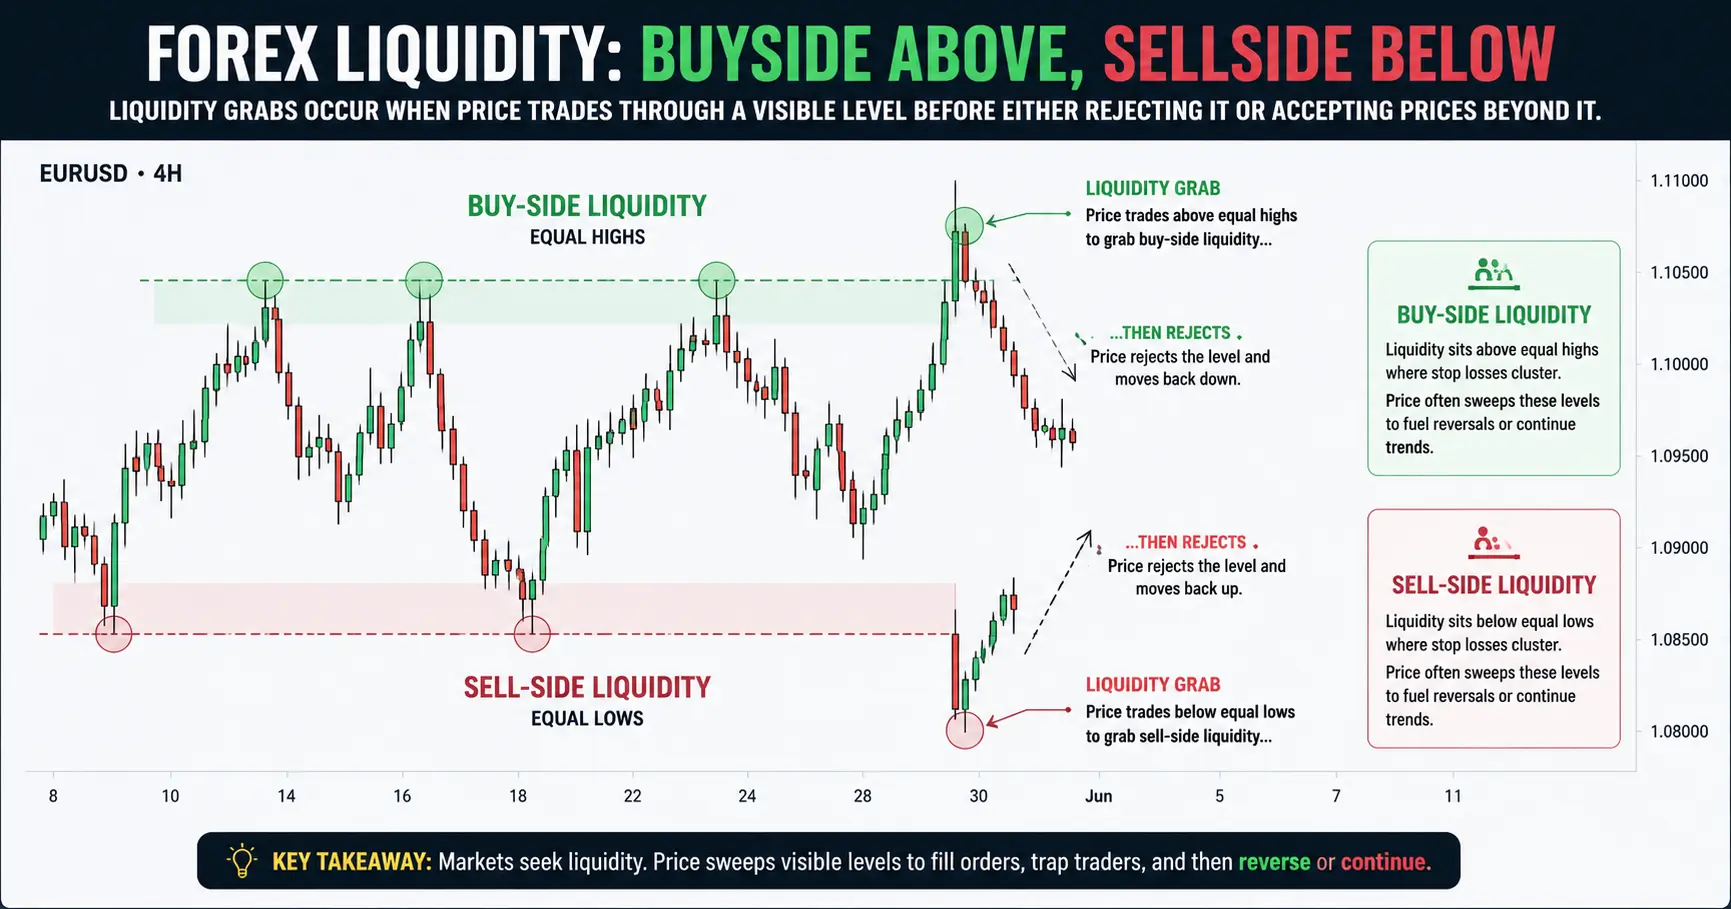
A liquidity grab in Forex is a temporary move beyond a visible high, low, or range boundary that activates clustered orders before price reacts. Traders use the concept to anticipate reversals or continuations, but a level breach alone is not a reliable signal. As of 2026, responsible liquidity analysis requires market context, structural confirmation, realistic execution assumptions, and clearly defined risk.
What Is Liquidity in Forex?
In market-microstructure terms, liquidity describes how easily an order can be executed without causing an unusually large price change.
A liquid market generally offers:
- Relatively tight bid-ask spreads
- Sufficient orders near the current market price
- Fast execution under normal conditions
- Limited slippage for ordinary order sizes
- The ability to absorb buying and selling without prolonged disruption
Liquidity is not simply “how much money is in the market.” It is a combination of available size, execution cost, speed, price impact, and the market’s ability to recover after a large order.
According to the Bank for International Settlements’ final 2025 analysis, average daily turnover in global over-the-counter foreign exchange markets reached approximately $9.5 trillion in April 2025, 27% higher than in April 2022. The preliminary BIS release had reported $9.6 trillion and 28% growth, but the later December 2025 analysis presented the final $9.5 trillion estimate used in this article.
That enormous aggregate figure does not mean liquidity is unlimited or evenly distributed. EUR/USD during the London–New York overlap is normally a different execution environment from an emerging-market currency pair during a regional holiday. Liquidity can also deteriorate around economic releases, political shocks, daily rollover, or periods when major dealing centers are closed.
Actual liquidity versus chart-inferred liquidity
Smart Money Concepts, or SMC, uses the word “liquidity” differently from a dealer, exchange, or execution analyst.
| Liquidity concept | Practical meaning | What a retail trader may observe | Main limitation |
|---|---|---|---|
| Executable liquidity | Orders that can be traded immediately | Bid, ask, spread, and available broker quotes | Represents only the broker or venue |
| Market depth | Available order size at several prices | Depth-of-market data on supported platforms | Spot Forex has no universal order book |
| Broker liquidity | Prices and size available through a broker’s providers | Spreads, fills, rejection rates, and slippage | Broker-specific |
| Futures liquidity | Centralized orders and trades on an exchange | Exchange volume and order-book data | Covers only the futures segment |
| SMC liquidity | Expected clusters of stops and pending orders | Equal highs, equal lows, swing points, and range boundaries | Inferred rather than directly observed |
A trader looking at equal highs at 1.1000 cannot normally see every stop-loss order above them. The trader is making a structured inference: visible resistance may attract short-seller stops and breakout buy orders.
That inference can be useful, but it is not the same as observing the complete order book.
Why spot Forex liquidity is fragmented
Spot Forex is an over-the-counter market. Transactions occur through banks, electronic trading platforms, non-bank liquidity providers, brokers, aggregators, and internal dealer systems rather than through one centralized exchange.
The BIS reported that electronic trading represented 59% of FX execution in April 2025. It also found that dealers matched more than 80% of customer trades inside their own internal liquidity pools in many circumstances. Much of the underlying trading activity is therefore not visible on public markets or a retail trading platform.
This fragmentation has an important implication: a retail candlestick chart shows price behavior from a particular data feed, not a consolidated global record of every order.

What Does Liquidity Mean in Smart Money Concepts?
Within Smart Money Concepts, liquidity usually refers to price areas where traders expect a concentration of executable orders.
These may include:
- Stop-loss orders
- Breakout buy-stop or sell-stop orders
- Take-profit orders
- Limit entries
- Algorithmic triggers
- Forced position liquidations
The central idea is that obvious technical levels tend to attract decisions from many market participants.
Buy-side liquidity
Buy-side liquidity refers to potential buy orders above a reference high.
These orders may include:
- Stop-loss orders from traders holding short positions
- Buy-stop orders from breakout traders
- Algorithmic orders activated above resistance
- Forced purchases required to close short positions
Suppose GBP/USD repeatedly reaches 1.2800 but fails to close above it. Traders may begin treating 1.2800 as resistance.
Short sellers might place their stops at 1.2810 or 1.2820. Breakout traders may place buy-stop entries slightly above 1.2800. If price later trades through the area, both types of order can create buying activity.
This expected concentration is described as buy-side liquidity.
Sell-side liquidity
Sell-side liquidity refers to potential sell orders below a reference low.
These may include:
- Stop-loss orders from long positions
- Sell-stop breakout orders
- Algorithmic orders below support
- Forced sales required to close leveraged long positions
If EUR/USD repeatedly holds 1.0750, long traders may place stops below the low while breakout traders prepare to sell if support fails. A move below 1.0750 can activate both groups.
Common liquidity locations
Traders frequently mark liquidity around:
- Equal or nearly equal highs
- Equal or nearly equal lows
- Previous-day highs and lows
- Previous-week highs and lows
- Major swing highs and lows
- Session range boundaries
- Consolidation highs and lows
- Round numbers such as 1.1000
- Obvious trendline breakout points
Research by the Federal Reserve Bank of New York found that stop-loss and take-profit currency orders in its dataset were strongly clustered near round numbers. The same research observed that triggered stop-loss orders could reinforce an existing price move. This supports the possibility of order concentration, although it does not allow a retail trader to know the exact order size around a specific modern chart level.
A practical chart-marking rule
Mark a liquidity level only when another trader could identify it without seeing the future outcome.
For example:
- Two or more clear reactions near the same high
- A previous-day high visible before the new session begins
- A well-defined range boundary
- A major swing point that caused a substantial move
Avoid marking every minor candle wick. Excessive marking makes almost any later price move appear to be a liquidity event.

What Is a Liquidity Grab in Forex?
A liquidity grab in Forex is a temporary move beyond a visible technical level that activates orders before price rejects or reclaims the breached area.
A bullish liquidity grab normally occurs below a low. Price trades into sell-side liquidity, then returns higher.
A bearish liquidity grab normally occurs above a high. Price trades into buy-side liquidity, then returns lower.
The definition describes price behavior. It does not prove that a bank, hedge fund, dealer, or algorithm deliberately moved the market to target retail traders.
The four-stage sequence
A practical liquidity-grab sequence contains four stages:
- A visible level forms.
Traders recognize a swing high, swing low, equal high, equal low, or range boundary. - Price breaches the level.
Orders above or below the level may be triggered. - Price fails to maintain acceptance.
The market returns through the breached area or closes back within the prior range. - Follow-through develops.
Price produces displacement, a structural change, or a move toward the opposite side of the range.
Without stages three and four, the event may simply be a breakout.
Hypothetical bullish example
Assume EUR/USD has a clearly defined range low at 1.0820.
- Price trades down to 1.0808
- Sell stops below 1.0820 may be activated
- A five-minute candle closes back at 1.0824
- Price rallies through a minor lower high at 1.0832
- A pullback holds above the swept low
The tradeable information is not merely that price reached 1.0808. The stronger evidence is that price failed to remain below 1.0820 and then disrupted the immediate bearish structure.
Hypothetical bearish example
Assume GBP/USD has equal highs at 1.2740.
- Price trades to 1.2755
- Buy stops above the highs may be triggered
- The candle closes back below 1.2740
- Bearish displacement breaks an internal higher low
- Price retests the reclaimed area and fails to recover
This sequence supports a bearish interpretation, but the trade still requires an invalidation level and acceptable target distance.
Minimum identification checklist
Before labeling a move a liquidity grab, confirm that:
- The liquidity level was marked before the breach
- The level was clear enough to attract broad attention
- Price traded meaningfully beyond it
- Price either reclaimed the level or showed measurable rejection
- Follow-through confirmed that rejection
- A logical invalidation level exists
- The label was not applied only after a profitable move became obvious

Liquidity Grab vs Liquidity Sweep vs Stop Run
There is no universal regulatory definition of “liquidity grab” or “liquidity sweep.” These are trading-education terms, and different educators use them differently.
For consistency, this article uses the following operational definitions.
| Term | Working definition | Must price reverse? | Main analytical focus |
| Liquidity grab | A relatively sharp breach and rejection of one main level | Usually implied | Reaction around one clear level |
| Liquidity sweep | A broader move through several nearby highs or lows | Not always | Collection of orders across an area |
| Stop run | A move accelerated by activated stop-loss orders | No | Order-triggered momentum |
| Failed breakout | A breakout that cannot maintain acceptance | Yes, at least temporarily | Failure beyond a range or structural boundary |
| Genuine breakout | A breach followed by acceptance and continuation | No reversal required | Sustained trading beyond the level |
A single candle may be called a liquidity grab by one trader and a sweep by another. The exact label is less important than the trader’s rules.
A more useful classification process
Ask four questions:
- Did price close beyond the level or only wick through it?
- How long did price remain outside the prior range?
- Did a retest hold beyond the level?
- Did subsequent structure confirm rejection or continuation?
For example, suppose EUR/USD trades above an equal high at 1.0950.
Scenario A: rejection
- High: 1.0962
- Close: 1.0946
- Next candle falls to 1.0928
- Retest of 1.0950 fails
This behavior supports a bearish liquidity-grab or failed-breakout interpretation.
Scenario B: acceptance
- High: 1.0962
- Close: 1.0958
- Two additional candles remain above 1.0950
- Retest holds at 1.0952
- Price continues to 1.0990
This is stronger evidence of a genuine breakout.

Why Liquidity Grabs Happen
Liquidity grabs do not require one universal cause. The same visual pattern may result from several interacting forces.
Stop-loss activation
A stop-loss becomes a market order or an executable instruction when its trigger conditions are met. If many stops are concentrated in the same area, their activation can reinforce price movement.
New York Fed research found evidence that currency stop-loss orders contributed to rapid, self-reinforcing price cascades. This provides a market-microstructure explanation for why price may accelerate after crossing a widely watched level.
Breakout participation
A resistance break may trigger:
- Short-covering purchases
- New breakout entries
- Algorithmic momentum orders
- Options-related hedging
The combined activity can push price beyond the level. If additional demand fails to appear, price may reverse. If demand persists, the breakout may continue.
Large-order execution
Large participants cannot always execute their entire desired position at one price. They may divide orders over time or trade where opposing interest is more available.
For example, a participant wishing to sell a large amount may find more buying interest above a well-known high, where short stops and breakout purchases are triggered.
However, this possibility should not be converted into a claim that every high was intentionally engineered. A retail chart does not normally reveal the participant’s identity or purpose.
Dealer inventory and hedging
Dealers may temporarily absorb client flow and later hedge remaining exposure. Because a substantial share of client activity may be internalized, the relationship between retail chart movement and underlying interdealer trading is not straightforward.
News and macroeconomic shocks
The April 2025 BIS survey took place during elevated volatility surrounding major US trade-policy announcements. BIS analysis concluded that hedging and trading around this period materially increased FX activity.
During a major news release, a liquidity-grab-like candle may be caused by:
- Rapid repricing of economic expectations
- Spread expansion
- Delayed liquidity-provider quotes
- Stop orders activating across several venues
- Algorithmic news trading
- Dealers reducing available size
- Temporary imbalance between market orders and resting interest
Calling every news spike a manipulation event is therefore an oversimplification.
Thin-market conditions
Liquidity may be less reliable during:
- Daily rollover
- Late New York trading
- Major public holidays
- The opening minutes of a regional session
- Unexpected geopolitical announcements
- Trading in less-liquid currency pairs
A 10-pip wick during a highly active session and a 10-pip wick during thin rollover conditions do not necessarily carry the same meaning.

How to Identify a High-Quality Liquidity Grab
A high-quality setup begins before price reaches the level. The trader should define the context, level, confirmation, invalidation, and target in advance.
Step 1: Establish the higher-timeframe context
Start with a daily, four-hour, or one-hour chart.
Determine whether price is:
- Trending
- Consolidating
- Reversing from a major area
- Approaching a previous-day or previous-week extreme
- Trading near the middle or edge of a broader range
A sweep below a low in a strong higher-timeframe uptrend may be more relevant than the same pattern in the middle of an erratic range.
Step 2: Mark liquidity before it is reached
Mark only levels visible in real time:
- Previous-day high or low
- Equal highs or lows
- Range boundaries
- Major swing points
- Session highs or lows
Take a screenshot before the event. This reduces hindsight bias.
Step 3: Evaluate level quality
A stronger level generally has:
- Clear visibility
- Multiple reactions
- Structural importance
- Alignment with a session extreme
- Sufficient space to the next target
A level becomes less useful when the chart is so crowded that almost every price can be labeled as liquidity.
Step 4: Observe the breach
Record:
- How far price traded beyond the level
- Whether the move was a wick or a candle close
- The speed of the breach
- Spread conditions
- Whether high-impact news was scheduled
- Whether price immediately returned
Step 5: Distinguish rejection from acceptance
Rejection may include:
- A close back inside the prior range
- Strong opposite-direction candles
- Failure to hold a retest
- A structural break away from the swept level
Acceptance may include:
- Repeated closes beyond the level
- A successful retest from the opposite side
- Continued displacement in the breakout direction
- Failure to return inside the prior range
Step 6: Require displacement
Displacement is a decisive directional move that shows stronger urgency than the preceding price action.
Possible signs include:
- Relatively large candle bodies
- Consecutive directional closes
- Limited overlap
- A break of an identifiable swing
- Price leaving an imbalance
Displacement has no universal numerical threshold. Define it objectively for the instrument and timeframe being tested.
Step 7: Wait for structural confirmation
Confirmation may involve:
- Change of Character, or CHoCH
- Market Structure Shift, or MSS
- Break of Structure, or BOS
- A reclaimed level holding on retest
- Failure of the original breakout direction
The chosen rule must remain consistent during backtesting.
Step 8: Calculate available reward
A setup can be technically valid but financially unattractive.
Assume:
- Entry: 1.0830
- Stop: 1.0810
- Nearest realistic target: 1.0850
The trade risks 20 pips to seek 20 pips, producing a gross 1:1 risk-to-reward ratio before spread, commission, or slippage.
If the trading plan requires at least 1:2, the setup should be rejected even when the pattern appears valid.
Liquidity-grab scorecard
| Factor | 0 points | 1 point | 2 points |
| Higher-timeframe context | Conflicting | Neutral | Clearly aligned |
| Liquidity level | Weak or subjective | Moderately clear | Obvious and pre-marked |
| Reclaim or rejection | None | Partial | Clear |
| Displacement | Weak | Moderate | Decisive |
| Structural confirmation | None | Minor | Defined framework confirmed |
| Execution conditions | Poor | Acceptable | Normal or favorable |
A score does not predict the outcome. It helps prevent impulsive trades by requiring the same questions each time.

CHoCH vs BOS After a Liquidity Grab
CHoCH and BOS are often presented as fixed signals, but their definitions vary across market-structure frameworks.
What is a Break of Structure?
A Break of Structure, or BOS, usually means price has broken a significant swing in the direction of the established trend.
In a bullish sequence:
- Price forms a higher high
- Pulls back to a higher low
- Then breaks the previous high
Many traders classify the new high as bullish BOS.
In a bearish sequence:
- Price forms a lower low
- Rallies to a lower high
- Then breaks the previous low
The new low may be classified as bearish BOS.
What is a Change of Character?
A Change of Character, or CHoCH, is typically an early break against the existing structural sequence.
Suppose price has been forming lower highs and lower lows. After sweeping a major low, price rises and breaks the most relevant lower high. Some traders call this bullish CHoCH because bearish behavior may be changing.
CHoCH is an alert, not proof of a full reversal.
Why traders disagree
Different frameworks may require:
- A wick through the swing
- A candle close through the swing
- A break of internal structure
- A break of external structure
- A break of the last protected high or low
- Displacement after the break
- A fair value gap
- A retest before confirmation
As a result, the same price move may be called CHoCH, MSS, or BOS by different traders.
Bullish sequence after sell-side liquidity
A possible bullish framework is:
- Price trades below a major low
- Price reclaims the low
- Bullish displacement develops
- The nearest meaningful lower high breaks
- The break is labeled CHoCH or MSS
- Price pulls back and forms a higher low
- A later higher high is labeled BOS
Bearish sequence after buy-side liquidity
A possible bearish framework is:
- Price trades above a major high
- Price falls back below it
- Bearish displacement develops
- The nearest meaningful higher low breaks
- The break is labeled CHoCH or MSS
- Price rallies and forms a lower high
- A later lower low is labeled BOS
| Feature | CHoCH | BOS |
| Typical purpose | Early warning of structural change | Continuation or later confirmation |
| Direction | Often against the prior sequence | Often with the established sequence |
| Timing | Earlier | Later |
| False-signal risk | Often higher | Still present |
| Guaranteed reversal or continuation | No | No |
A CHoCH can become an ordinary pullback. A BOS can occur immediately before price reaches major opposing liquidity and reverses.

A Multi-Timeframe Liquidity-Grab Process
A multi-timeframe process prevents a small lower-timeframe pattern from being interpreted without broader context.
Higher timeframe: define location
Use a daily or four-hour chart to mark:
- Major trend or range
- Previous-week high and low
- Major swing points
- Important support and resistance
- Areas where a reversal would materially change structure
Setup timeframe: identify the event
Use a one-hour or 15-minute chart to identify:
- Equal highs or lows
- Previous-day levels
- Session boundaries
- Consolidation edges
- A clear approach into liquidity
Entry timeframe: require confirmation
Use a five-minute or one-minute chart only after price reaches the higher-timeframe area.
Possible confirmation:
- Reclaim of the swept level
- Displacement
- CHoCH
- Retest of broken structure
- Rejection from an imbalance
- Failure to continue beyond the level
Worked hypothetical scenario
Assume:
- Four-hour market structure is bullish
- Previous-day low is 1.0820
- Price trades to 1.0808
- Price reclaims 1.0820
- Five-minute CHoCH occurs above 1.0832
- Pullback entry is 1.0828
- Stop-loss is 1.0806
- Target is the previous-day high at 1.0872
Calculations:
- Risk: 1.0828 − 1.0806 = 22 pips
- Reward: 1.0872 − 1.0828 = 44 pips
- Gross risk-to-reward ratio: 1:2
The setup is invalid before entry if:
- Price closes and accepts below 1.0808
- The bullish CHoCH fails immediately
- Spread expands beyond the strategy’s tested maximum
- A scheduled event makes execution conditions unsuitable
- The target is reached before a valid pullback entry occurs
This is a hypothetical educational example, not live market data or a trade recommendation.

Entry Models After a Liquidity Grab
There are three common entry approaches. None is universally superior.
Model 1: Immediate reclaim entry
The trader enters after a candle closes back through the breached level.
Example:
- Equal lows: 1.0820
- Sweep low: 1.0808
- Reclaim close: 1.0823
- Entry: 1.0824
- Stop: 1.0805
Advantages
- Early entry
- Potentially smaller stop
- Greater potential reward-to-risk ratio
Disadvantages
- Limited confirmation
- Greater exposure to a second sweep
- Reclaim may fail
Model 2: CHoCH confirmation entry
The trader waits for price to break a relevant internal swing.
Example:
- Sweep low: 1.0808
- Minor lower high: 1.0832
- Bullish close above 1.0832
- Entry after confirmation: 1.0835
- Stop: 1.0805
The later entry increases the stop distance to 30 pips unless a tighter structural stop is available.
Advantages
- More evidence that short-term structure has changed
- Easier to define the setup objectively
Disadvantages
- Lower potential reward
- Price may move without offering an entry
- The structural break may still fail
Model 3: Retest entry
The trader waits for price to pull back after displacement.
Possible retest areas include:
- The reclaimed liquidity level
- Broken internal structure
- An imbalance or fair value gap
- The origin of the displacement move
Example:
- CHoCH above 1.0832
- Pullback to 1.0828
- Entry: 1.0829
- Stop: 1.0805
Advantages
- More favorable entry than chasing displacement
- Clear invalidation
- Potentially improved reward-to-risk ratio
Disadvantages
- Price may not retrace
- Retest may deepen and invalidate the trade
- Traders may force entries into weak reactions
| Entry model | Confirmation | False-reversal exposure | Missed-trade risk | Typical profile |
| Immediate reclaim | Low | Higher | Lower | Aggressive |
| CHoCH confirmation | Medium to high | Moderate | Moderate | Balanced |
| Retest | High if valid | Moderate | Higher | Patient |
Stop-Loss Placement and Trade Invalidation
A stop-loss should represent the price at which the trade premise is no longer valid. It should not be selected only to produce a visually attractive risk-to-reward ratio.
Structural stop beyond the sweep
For a bullish setup, the stop may be placed below the liquidity-grab low.
Example:
- Entry: 1.0828
- Sweep low: 1.0808
- Stop: 1.0805
- Distance: 23 pips
The three-pip allowance below the sweep is not guaranteed protection. It simply avoids placing the stop exactly at the visible extreme.
Confirmation-swing stop
A trader entering after CHoCH may place the stop below the swing that created the confirmation.
This can reduce stop distance, but only when a break of that swing genuinely invalidates the setup.
Volatility-adjusted stop
Average True Range, or ATR, measures recent price movement. A trader may use a fraction or multiple of ATR to prevent the stop from being too close for the instrument’s normal volatility.
ATR does not predict direction. It only helps standardize distance.
Spread and slippage
A stop trigger is not always the final execution price. The New York Fed has noted that slippage is the difference between an intended or triggered order level and the actual execution price, and that liquidity conditions can magnify it.
Slippage risk may increase during:
- High-impact news
- Weekend gaps
- Daily rollover
- Sudden geopolitical events
- Thin trading conditions
Invalidation versus discomfort
A trade moving temporarily against the entry does not automatically mean the premise has failed.
Define invalidation before entry, such as:
- Acceptance below the sweep low
- Failure of the structural break
- A close beyond a protected swing
- Breakdown of the higher-timeframe thesis
Changing the stop simply because a normal pullback feels uncomfortable replaces analysis with emotion.
Position Sizing and Risk-to-Reward Calculation
Position size should be calculated from the amount the trader can afford to lose, not from the desired profit.
Worked risk example
Assume:
- Account balance: $10,000
- Risk per trade: 0.5%
- Maximum planned risk: $50
- Entry: 1.0828
- Stop: 1.0803
- Stop distance: 25 pips
For EUR/USD in a US-dollar-denominated account, one standard lot of 100,000 units has a pip value of approximately $10 per pip because one pip equals 0.0001 × 100,000.
Position-size formula:
Position size = Dollar risk ÷ (Stop distance × Pip value per standard lot)
Calculation:
$50 ÷ (25 × $10) = 0.20 standard lots
At 0.20 lots:
- Approximate pip value: $2 per pip
- Planned 25-pip loss: $50
The calculation changes when the quote currency or account currency is not USD. Use the broker’s contract specifications or a verified position-size calculator.
Risk-to-reward example
Assume:
- Entry: 1.0828
- Stop: 1.0803
- Target: 1.0878
Calculations:
- Risk: 25 pips
- Potential reward: 50 pips
- Gross risk-to-reward ratio: 1:2
- Planned gross loss at 0.20 lots: approximately $50
- Planned gross gain at 0.20 lots: approximately $100
Actual results may differ because of spread, commission, swap charges, slippage, partial fills, or manual execution.
Break-even win rate
The theoretical break-even win rate before costs is:
Break-even win rate = 1 ÷ (1 + reward-to-risk multiple)
| Average reward-to-risk | Theoretical break-even win rate |
| 1:1 | 50.0% |
| 1:1.5 | 40.0% |
| 1:2 | 33.3% |
| 1:3 | 25.0% |
A strategy with a 40% win rate can be profitable if its average winner is sufficiently larger than its average loser. It can still lose money when transaction costs, execution errors, or inconsistent exits reduce the realized reward.

Trade Management and Exit Strategies
The exit method affects win rate, average profit, drawdown, and psychological difficulty.
Fixed-target exit
The trader closes the entire position at:
- A fixed multiple such as 2R
- The next opposing liquidity pool
- A previous-day high or low
- A major swing point
This method is simple and easy to backtest.
Partial-profit model
Assume a 0.20-lot position with 25 pips of risk.
A trader might:
- Close 0.10 lots at 1R, gaining approximately $25
- Hold the remaining 0.10 lots toward 3R
- Keep the original stop or adjust it according to tested rules
If the remainder reaches 3R:
- First portion: approximately +$25
- Second portion: approximately +$75
- Total: approximately +$100, equal to 2R on the original $50 risk
If the second portion returns to the original stop:
- First portion: approximately +$25
- Second portion: approximately −$25
- Total before costs: approximately $0
Structure-based trailing stop
In a long position, the stop may be trailed below confirmed higher lows. In a short position, it may be trailed above confirmed lower highs.
This approach may capture larger moves but can return substantial open profit during deep pullbacks.
Time-based exit
A setup may be closed when:
- Price fails to move after a defined number of candles
- The active session ends
- A scheduled high-impact event approaches
- The original momentum disappears
Premature break-even risk
Moving a stop to break-even immediately after a small favorable move can increase the number of zero-result trades while removing positions that later reach their targets.
The correct break-even rule is the one supported by the strategy’s data, not the one that feels safest in a single trade.
| Exit method | Strength | Main weakness |
| Fixed target | Simple and measurable | May exit before a larger move |
| Partial profit | Reduces emotional pressure | Can reduce average winner |
| Structural trail | Can capture trends | Returns open profit during pullbacks |
| Time-based exit | Limits stagnant exposure | May exit before delayed follow-through |
Chart-Reading Case Study
The following case study is hypothetical.
Context
GBP/USD is trading inside a four-hour range.
- Equal highs: 1.2740
- Range midpoint: 1.2715
- Lower range area: 1.2685
- Previous-day high: near 1.2740
- Active period: London–New York overlap
The equal highs and previous-day high create a clear buy-side liquidity area.
Liquidity event
Price rises from 1.2720 and trades to 1.2755, 15 pips above the equal highs.
The move itself is not enough to justify a short position.
Confirmation
The following behavior occurs:
- Price closes back below 1.2740
- A bearish displacement candle reaches 1.2728
- Price breaks an internal higher low at 1.2725
- A retest reaches 1.2735 but fails below 1.2740
Entry plan
- Short entry: 1.2735
- Stop-loss: 1.2760
- Risk: 25 pips
- First target: 1.2710
- Second target: 1.2685
Risk-to-reward:
- Target one: 25 pips, or 1R
- Target two: 50 pips, or 2R
Position size
Assume:
- Account: $20,000
- Risk: 0.5%
- Dollar risk: $100
- Stop: 25 pips
- GBP/USD pip value per standard lot in a USD account: approximately $10
$100 ÷ (25 × $10) = 0.40 standard lots
Approximate outcomes before costs:
- Stop-loss: −$100
- Target one: +$100
- Target two: +$200
Alternative outcome
Suppose price instead:
- Closes above 1.2755
- Pulls back to 1.2740
- Holds 1.2740 as support
- Continues toward 1.2790
The bearish liquidity-grab thesis is invalid. The market has shown acceptance above the highs, making continuation more plausible.
A disciplined trader must respond to the acceptance evidence rather than remaining attached to the original reversal story.

How to Distinguish a Liquidity Grab from a Genuine Breakout
The difference is rarely visible from the first wick alone.
Signs of rejection
- Price closes back within the previous range
- The move beyond the level is brief
- Opposite-direction displacement follows
- A retest of the level fails
- Structure breaks against the original breakout
- Price moves toward the opposite liquidity pool
Signs of acceptance
- Price closes beyond the level
- Additional candles remain outside the range
- The level holds on retest
- Directional follow-through continues
- Pullbacks remain shallow
- The breakout creates new supporting structure
Decision tree
- Was the level marked in advance?
If not, the analysis may be hindsight-driven. - Did price trade beyond it?
If not, no sweep or breakout occurred. - Where did the candle close?
A close back inside supports rejection; a close outside supports possible acceptance. - What happened on the retest?
Failure beyond the level supports a grab; support beyond it favors breakout continuation. - Did structure confirm?
Look for a defined CHoCH, BOS, or failure pattern. - Is there enough target space?
A correct directional view may still produce a poor trade. - Were execution conditions abnormal?
News and spread expansion may reduce the value of candle-based confirmation.
| Evidence | Rejection interpretation | Acceptance interpretation |
| First close | Back inside range | Beyond level |
| Follow-through | Opposite direction | Breakout direction |
| Retest | Fails beyond level | Holds beyond level |
| Structure | Breaks against breakout | Builds beyond breakout |
| Trade bias | Possible reversal | Possible continuation |
Session Timing and Liquidity Conditions
Liquidity changes throughout the trading day. Session labels are useful, but they should not be treated as mechanical signals.
Asian session
The Asian session may produce narrower ranges in some major European and North American currency pairs, although conditions vary by pair and macroeconomic environment.
Useful reference points may include:
- Asian-session high
- Asian-session low
- Prior New York close
- Regional economic releases
The idea that London must always sweep the Asian range is not a market rule.
London open
European participation increases around the London open. Overnight highs and lows may attract activity as banks, funds, corporates, and algorithmic traders enter the market.
Possible conditions:
- Rapid expansion from an overnight range
- False breaks of session extremes
- Directional continuation from established macro trends
London–New York overlap
The overlap generally brings participation from two major dealing regions. Major USD pairs may offer stronger movement and more stable execution than during quieter periods, although major US releases can create severe volatility.
New York afternoon and rollover
As European participation declines, activity may fall. Around daily rollover, traders may experience:
- Wider spreads
- Reduced quoted size
- Swap processing
- Short-lived price spikes
- Less consistent lower-timeframe patterns
News-release conditions
A scheduled release can produce:
- Spread expansion
- Slippage
- Price gaps between available quotes
- Delayed fills
- Rapid moves through several levels
A strategy tested in normal conditions should not automatically be used during high-impact news.
| Period | Typical consideration | Main risk |
| Asian session | Range formation and regional pairs | Overgeneralizing low volatility |
| London open | Expansion around overnight levels | Early false break |
| London–New York overlap | Greater participation | News-driven volatility |
| New York afternoon | Declining activity | Reduced follow-through |
| Rollover | Operational repricing | Spread widening |

Using Volume and Order-Flow Tools Responsibly
Volume can add context, but no single retail tool reveals the entire FX market.
Tick volume
Most retail spot-Forex platforms display tick volume: the number of price updates during a candle.
Tick volume can help identify unusually active periods on the same data feed, but it is not consolidated global transaction volume.
Currency futures volume
Currency futures trade on centralized exchanges, where volume and resting orders are observable.
CME reported average daily FX futures volume of $85.7 billion during 2025, with more than $43 trillion cleared over the year. This is a meaningful centralized market, but it remains only one part of the much larger global OTC FX system.
A trader may compare EUR/USD spot price behavior with euro futures activity, but should account for:
- Contract specifications
- Futures expiration
- Basis differences
- Trading-hour effects
- The partial nature of the proxy
Depth of market
Depth-of-market data shows orders available through a specific venue, broker, or liquidity network.
It can help with:
- Short-term execution
- Observing local order concentration
- Estimating immediate available size
It should not be described as the complete interbank order book.
| Tool | Best use | Limitation |
| Tick volume | Relative activity on one feed | Not consolidated trade volume |
| Futures volume | Centralized confirmation | Covers only the futures market |
| Depth of market | Local execution decisions | Venue-specific |
| Candlestick structure | Broad contextual analysis | No direct order visibility |
Use volume as supporting evidence. A high-volume rejection does not prove that institutions intentionally hunted a specific group of traders.
Common Liquidity-Grab Trading Mistakes
Labeling every wick a liquidity grab
Why it happens: The trader focuses on candle shape rather than context.
Correction: Require a pre-marked level, a meaningful breach, rejection or reclaim, and follow-through.
Marking the level after the reversal
Why it happens: Historical charts make important levels look obvious.
Correction: Save a screenshot before price reaches the area.
Entering before confirmation
Why it happens: Fear of missing the move.
Correction: Define the exact close, reclaim, displacement, or structure break required.
Mixing internal and external structure
Why it happens: The trader switches between minor and major swings to justify a preferred bias.
Correction: Define the swing hierarchy and timeframe before backtesting.
Ignoring acceptance
Why it happens: The trader assumes every sweep must reverse.
Correction: Treat repeated closes and successful retests beyond the level as evidence against the reversal thesis.
Placing the stop exactly at the sweep extreme
Why it happens: A smaller stop produces a more attractive projected reward-to-risk ratio.
Correction: Place the stop where the premise is invalid, accounting for normal spread and volatility.
Trading into opposing liquidity
Why it happens: The entry pattern is evaluated without considering target distance.
Correction: Calculate reward before placing the order.
Treating CHoCH as guaranteed reversal
Why it happens: Simplified trading education presents structure labels as signals.
Correction: Require context, follow-through, and risk management.
Ignoring transaction costs
Why it happens: Backtests assume perfect entries and exits.
Correction: Model spread, commission, slippage, swaps, and missed fills.
How to Backtest a Liquidity-Grab Strategy
A backtest should test fixed rules, not a visual idea that changes from chart to chart.
Step 1: Write objective rules
Define:
- Currency pairs
- Trading sessions
- Timeframes
- Valid liquidity levels
- Minimum number of equal highs or lows
- Maximum distance between equal levels
- Wick or candle-close requirements
- CHoCH and BOS definitions
- Entry method
- Stop method
- Target method
- News exclusions
- Maximum spread
Step 2: Prevent look-ahead bias
Use bar replay or advance the chart one candle at a time.
Do not mark a level because a later reversal made it appear important.
Step 3: Build an exploratory sample
A starting sample of at least 100 valid setups can reveal basic tendencies, but 100 trades may still be too small for strong statistical confidence—especially when results are divided across pairs, sessions, and setup types.
Step 4: Record meaningful metrics
Track:
- Win rate
- Average winning trade
- Average losing trade
- Expectancy
- Profit factor
- Maximum drawdown
- Maximum adverse excursion
- Maximum favorable excursion
- Average spread
- Slippage
- Session
- Currency pair
- Setup score
- Rule violations
Step 5: Calculate expectancy
Formula:
Expectancy = (Win rate × Average win) − (Loss rate × Average loss)
Hypothetical results:
- Win rate: 42%
- Average win: 1.8R
- Loss rate: 58%
- Average loss: 1R
Calculation:
(0.42 × 1.8R) − (0.58 × 1R)
0.756R − 0.58R = 0.176R per trade before costs
If average trading costs equal 0.05R per trade:
0.176R − 0.05R = 0.126R estimated expectancy after modeled costs
This remains a historical estimate, not a promise of future performance.
Step 6: Segment the results
Compare performance by:
- Pair
- Session
- Day of week
- Higher-timeframe direction
- News versus non-news conditions
- Equal-high or equal-low setup
- Previous-day level setup
- Entry model
- Stop method
A strategy may appear profitable overall while depending entirely on one currency pair or market regime.
Step 7: Forward-test execution
Use a demo account or the smallest practical position size to measure:
- Real spreads
- Slippage
- Order rejections
- Missed retests
- Psychological rule violations

Practical Liquidity-Grab Checklist
Before the setup
- Is the level marked in advance?
- Is the higher-timeframe context clear?
- Is the market trending or ranging?
- Is major economic news approaching?
- Is the next target identifiable?
- Is execution normally reliable at this time?
After the breach
- Did price close back inside or remain outside?
- Was the level reclaimed?
- Did displacement occur?
- Did CHoCH or BOS occur under the predefined rules?
- Did the retest hold or fail?
- Is the spread acceptable?
Before placing the order
- Exact entry price
- Exact stop price
- Exact invalidation condition
- Stop distance in pips
- Maximum dollar risk
- Position size
- First target
- Final target
- Gross reward-to-risk ratio
- Event-risk check
After the trade
- Save before-and-after screenshots
- Record actual spread and slippage
- Record whether every rule was followed
- Grade the decision separately from the financial result
- Do not change the strategy after one trade
Limitations of Liquidity-Grab Analysis
Liquidity-grab analysis has real limitations that should be stated openly.
| Limitation | Why it matters | Practical response |
| No consolidated spot-FX order book | Exact global stop concentrations are unknown | Treat liquidity pools as hypotheses |
| Participant intent is hidden | A wick cannot prove manipulation | Describe behavior, not motives |
| Swing selection is subjective | Traders may label structure differently | Use fixed swing rules |
| Broker feeds differ | Highs, lows, and candle closes can vary | Test on the execution feed used |
| Market regimes change | Historical behavior may weaken | Reassess performance periodically |
| Slippage is uncertain | Loss may exceed planned amount | Reduce size around unstable conditions |
| Structure can fail | CHoCH and BOS are not guarantees | Use predefined invalidation |
The December 2024 FX Global Code promotes good practices intended to support a robust, fair, liquid, open, and appropriately transparent wholesale FX market. It is a principles-based code rather than proof that every participant follows identical practices or that every sharp move is improper.
The most defensible approach is to say:
- Price traded beyond a visible level
- Orders may have been activated
- Price rejected or accepted the area
- Structure then confirmed or contradicted the setup
Avoid claiming to know which institution caused the move unless reliable evidence exists.
Frequently Asked Questions
A liquidity grab is a temporary move beyond a visible high, low, or range boundary followed by rejection or reclaim. Traders interpret the move as activation of orders near the level, but the chart does not prove deliberate institutional manipulation.
In this article, a liquidity grab is a relatively sharp breach of one main level, while a liquidity sweep moves through several nearby highs or lows. The terminology is not standardized, so traders should define both terms before backtesting.
No. Price may reject briefly and then continue through the level, or it may immediately establish acceptance beyond it. Reclaim, displacement, retest behavior, and subsequent structure are more useful than the first wick alone.
Immediate entry offers an earlier price but less confirmation. Waiting for CHoCH, displacement, or a retest may reduce false entries, although the trade can be missed or entered at a less favorable price.
No timeframe is universally best. A practical approach is to establish context on a four-hour or one-hour chart, identify the liquidity event on a 15-minute chart, and use a five-minute chart for confirmation and execution. The combination should be tested on the chosen pair and session.
Conclusion: Trade the Reaction, Not the Story
A liquidity grab in Forex is not valuable because it offers a dramatic story about institutions hunting retail stops. It is valuable only when it helps a trader organize observable information.
The strongest process is to:
- Mark a clear level before price reaches it
- Observe whether the market rejects or accepts the breach
- Require displacement or structural confirmation
- Define CHoCH and BOS consistently
- Calculate stop distance and position size before entry
- Confirm that sufficient reward remains
- Record execution costs and test the setup over a meaningful sample
As of July 2026, global FX trading remains enormous, decentralized, fragmented, and only partially visible to any individual market participant. A retail chart cannot reveal the complete market’s intentions. It can, however, support a disciplined decision when the trader uses objective definitions and controlled risk.
Choose one liquidity-grab model, document its exact rules, and test at least 100 valid historical examples before risking meaningful capital.
Financial Risk Disclaimer
Foreign exchange and leveraged trading involve substantial risk and are not suitable for every person. Leverage can magnify both gains and losses, and a relatively small adverse price movement may result in a significant loss. Depending on the broker, product, jurisdiction, account protections, and market conditions, losses may exceed the initial deposit where negative-balance protection is not provided.
All prices, account balances, entries, stop-loss levels, targets, position sizes, win rates, and performance calculations in this article are hypothetical educational examples unless explicitly identified as sourced market data. They do not represent live trading instructions, guaranteed outcomes, or personalized recommendations.
Stop-loss orders cannot guarantee execution at the requested price. Slippage, spread expansion, price gaps, low liquidity, system interruptions, and market volatility may cause a different result.
Historical results, simulations, and backtests do not guarantee future performance. Traders should independently verify broker authorization, margin requirements, leverage limits, product terms, client-money protections, execution policies, and dispute procedures applicable in their country.
The Commodity Futures Trading Commission advises prospective retail Forex customers to research over-the-counter dealers carefully and emphasizes that Forex trading is highly risky.
This article is general educational information and does not constitute investment, financial, legal, accounting, or tax advice. Consider obtaining advice from appropriately qualified professionals before trading or making financial decisions.