

 PIPAVO Team
Learn what a Fair Value Gap is, how bullish and bearish FVGs form, how they differ from imbalances, and how traders manage entries and risk.
In this article
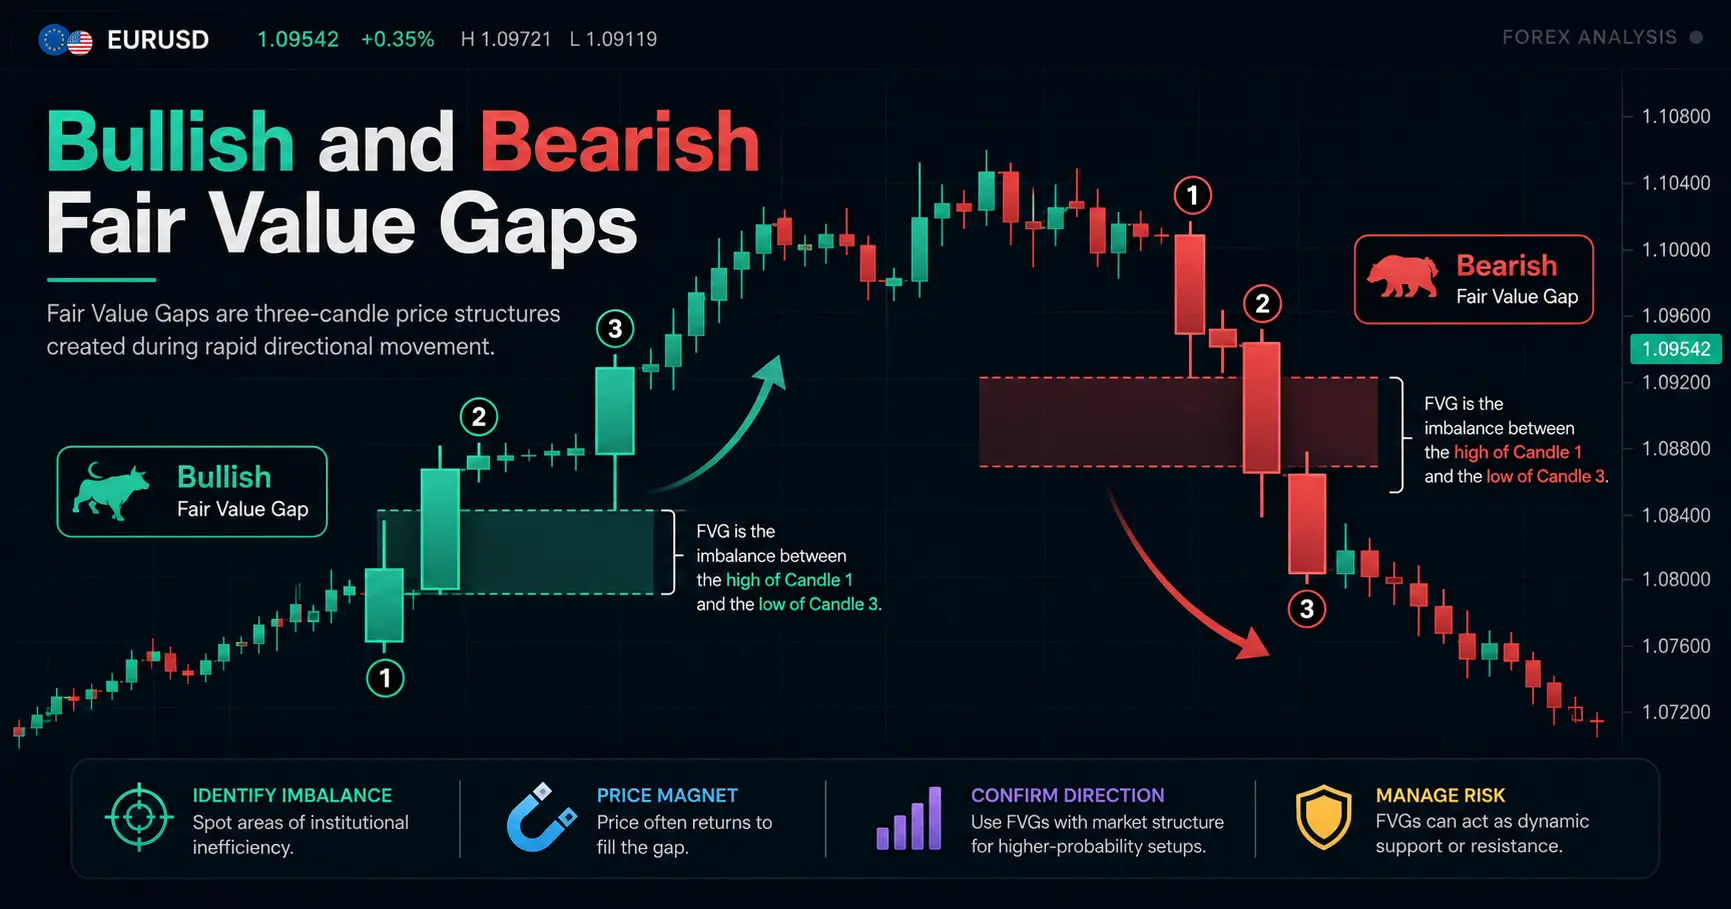
A Fair Value Gap, or FVG, is a three-candle price-action pattern in which part of the first candle’s range does not overlap with the third candle’s range. Traders use the resulting zone to study rapid price movement and possible retracements, but an FVG does not guarantee that price will return, reverse, or continue.
As of 2026, FVG analysis remains popular within Smart Money Concepts and ICT-style trading. However, it should be treated as a chart framework—not direct proof of institutional orders or economic fair value.
What Is a Fair Value Gap in Forex Trading?
A Fair Value Gap is a specific visual structure formed when price moves rapidly enough that the wicks of Candle 1 and Candle 3 do not overlap across part of the middle candle’s range.
The pattern consists of:
- Candle 1: The candle before the strongest part of the move.
- Candle 2: The displacement candle that drives price sharply higher or lower.
- Candle 3: The candle that confirms whether a non-overlapping price zone remains.
The zone between Candle 1 and Candle 3 is marked as the FVG.
This article uses a wick-to-wick definition because it creates an objective rule that can be tested. Some traders use candle bodies instead, but body-based and wick-based FVGs are different patterns and should not be mixed within the same strategy.

Bullish Fair Value Gap
A bullish FVG forms when:
Candle 3 low > Candle 1 high
Consider this hypothetical EUR/USD sequence:
| Candle | Relevant price |
|---|---|
| Candle 1 high | 1.0840 |
| Candle 2 | Strong bullish displacement |
| Candle 3 low | 1.0852 |
The resulting bullish FVG extends from 1.0840 to 1.0852.
Its size is:
1.0852 − 1.0840 = 0.0012
For most EUR/USD quotations, 0.0012 equals 12 pips.
A trader may monitor this zone if price later retraces from above. The lower boundary is 1.0840, the upper boundary is 1.0852, and the midpoint is:
(1.0840 + 1.0852) ÷ 2 = 1.0846
The pattern does not mean buyers must defend 1.0846 or that price must revisit it. It simply records a section of rapid upward price delivery.
Bearish Fair Value Gap
A bearish FVG forms when:
Candle 3 high < Candle 1 low
Consider a hypothetical GBP/USD sequence:
| Candle | Relevant price |
| Candle 1 low | 1.2715 |
| Candle 2 | Strong bearish displacement |
| Candle 3 high | 1.2703 |
The bearish FVG extends from 1.2703 to 1.2715, giving a width of 12 pips.
A trader looking for a bearish continuation could monitor the zone if price retraces upward. However, a reaction from the zone is only a possibility. Price may stop below it, enter it partially, trade through it, or never revisit it.
Fair Value Gap vs Imbalance: Are They the Same?
An FVG and an imbalance are related ideas, but they are not always identical.
In retail price-action language, imbalance is often used broadly to describe a fast, one-sided move with limited candle overlap. A Fair Value Gap is a narrower construction with a defined three-candle rule.
More importantly, neither term should automatically be confused with a measurable order-flow imbalance.
What an FVG Measures
A standard FVG uses only candlestick information:
- Open
- High
- Low
- Close
- Time interval
It shows that Candle 1 and Candle 3 did not overlap across part of Candle 2’s range on a particular chart and timeframe.
It does not reveal:
- The identity of buyers or sellers
- The number of orders submitted
- Total global volume at each price
- Whether institutions caused the move
- Whether no transactions occurred in the zone
- The volume available at every bid and offer
This distinction matters in spot Forex because trading is decentralized rather than recorded through one universal exchange.
FVG, Liquidity Void and Order-Flow Imbalance Compared
| Concept | Primary data | Typical identification | What it may suggest | Main limitation |
| Fair Value Gap | OHLC candles | Three-candle wick non-overlap | Rapid directional price delivery | Does not measure actual order flow |
| General price imbalance | Price action | Large candles, limited overlap or fast movement | One side temporarily dominated price movement | Definition varies between traders |
| Liquidity void | Price and sometimes volume profile | Thinly traded or rapidly crossed range | Limited two-way activity at the observed venue | Difficult to verify globally in spot Forex |
| Bid/ask imbalance | Order-book or execution data | More volume or depth on one side | Uneven displayed buying and selling interest | Venue-specific and rapidly changing |
| Volume imbalance | Transaction or footprint data | Disproportionate volume at bid or ask | Aggressive buying or selling | Requires suitable centralized or venue-level data |
| Weekend gap | Session closing and reopening prices | New week opens away from prior close | Information was repriced while the market was closed | Structurally different from an intraday FVG |

A visible FVG is therefore best described as a candlestick geometry condition. Calling it an order imbalance may be convenient, but it can overstate what a retail chart actually proves.
Why Do Fair Value Gaps Form?
FVGs tend to appear during displacement—a fast directional move in which price expands beyond its recent range with relatively little overlap.
Possible catalysts include:
- Central-bank decisions
- Inflation or employment data
- Unexpected economic releases
- Political or geopolitical developments
- Breakout orders
- Stop-loss execution
- Reduced liquidity
- Algorithmic repricing
- Large hedging flows
- A rapid change in market expectations
The 2025 BIS Triennial Central Bank Survey reported approximately $9.6 trillion in average daily over-the-counter FX turnover during April 2025, up 28% from $7.5 trillion in 2022. Spot turnover was around $3 trillion per day, outright forwards $1.8 trillion and FX swaps $4 trillion. The BIS also noted that the April 2025 survey occurred amid elevated volatility following major trade-policy announcements.
These figures illustrate the scale of the FX market, but they do not prove that a specific five-minute FVG was created by a bank or institutional trader.
Why Broker Charts May Differ
The BIS survey covers data reported by more than 1,100 banks and dealers across 52 jurisdictions, reinforcing that global OTC Forex activity is distributed across many institutions and trading relationships rather than one centralized order book.
As a result:
- One broker’s high may differ slightly from another broker’s high.
- Session-closing conventions may create different candles.
- A small FVG may appear on one feed but not another.
- Spread widening can affect displayed bid and ask prices.
- Tick aggregation can change lower-timeframe candle shapes.
A one-pip FVG visible on only one price feed is less robust than a clear displacement zone visible across several reputable feeds or on a higher timeframe.

How to Identify a Valid Fair Value Gap
Not every three-candle non-overlap deserves a trade. A useful identification process separates the existence of an FVG from the quality of a trading setup.
Step 1: Confirm the Three-Candle Geometry
For a bullish FVG:
Candle 3 low must be above Candle 1 high.
For a bearish FVG:
Candle 3 high must be below Candle 1 low.
Mark the exact boundaries. Do not expand the zone simply because a larger area looks visually convenient.
Step 2: Evaluate Displacement
A stronger displacement candle commonly has:
- A relatively large real body
- A close near its high in a bullish move
- A close near its low in a bearish move
- Limited opposing wick
- Expansion beyond recent candles
- A break through a meaningful level
“Large” should be defined relative to the market and timeframe. One possible testing rule is to require Candle 2’s true range to be at least 1.5 times the median true range of the previous 20 candles. That is a hypothetical research rule, not a universal standard.
Step 3: Check Location
An FVG may have greater contextual relevance when it forms:
- After a sweep of an obvious high or low
- Near a higher-timeframe support or resistance area
- At the edge of a trading range
- During a confirmed directional expansion
- After a meaningful structural break
An FVG in the middle of a narrow range often has little space to reach a logical target.
Step 4: Identify the Structural Event
Ask which level price actually broke.
Breaking a minor two-candle pivot is not the same as breaking a major swing that has controlled price for several sessions. The importance of the FVG depends partly on the importance of the structure associated with it.
Step 5: Check the Trade Economics
Before considering an entry, calculate:
- Entry price
- Logical invalidation price
- Stop distance
- Nearest realistic target
- Spread
- Commission
- Possible slippage
- Expected reward-to-risk ratio
A valid pattern can still be a poor trade.
FVG Quality Checklist
| Question | Stronger context | Weaker context |
| Was there clear displacement? | Large body and decisive close | Small overlapping candles |
| Was meaningful structure broken? | Major swing or range boundary | Minor internal pivot |
| Did liquidity appear to be swept? | Clear move beyond an obvious extreme | No identifiable liquidity event |
| Where did the FVG form? | Range edge or higher-timeframe area | Middle of congestion |
| Is this the first revisit? | Untested zone | Multiple prior tests |
| Is there room to target? | Clear opposing swing or liquidity | Nearby obstacle |
| Are costs manageable? | Zone and target exceed normal costs comfortably | Spread consumes much of the setup |
| Is major news close? | No immediate high-impact release | Entry immediately before major data |

Bullish and Bearish FVG Trading Scenarios
The direction of an FVG describes the move that created it. It does not independently predict what price will do next.
Bullish Scenario
A contextual bullish sequence may look like this:
- EUR/USD trades below a prior intraday low.
- Price quickly recovers above that low.
- A large bullish candle breaks a relevant swing high.
- The move leaves a bullish FVG below the current price.
- Price retraces into the zone.
- The trader applies a predefined entry and stop rule.
- A previous high becomes the potential target.
This sequence combines liquidity, displacement and structure. An isolated bullish FVG without those conditions may be less informative.
Bearish Scenario
A contextual bearish sequence may look like this:
- GBP/USD trades above a previous session high.
- Price fails to hold above that level.
- Bearish displacement breaks a relevant swing low.
- A bearish FVG remains above price.
- Price retraces upward.
- The trader enters only if the strategy’s conditions are satisfied.
- A prior low provides a potential target.
Premium and Discount
Some Smart Money Concepts frameworks divide a selected swing range into two halves:
- Premium: Above the 50% midpoint
- Discount: Below the 50% midpoint
- Equilibrium: The 50% level
For a range from 1.0800 to 1.1000:
- Total range: 200 pips
- Midpoint: 1.0900
- Premium: 1.0900–1.1000
- Discount: 1.0800–1.0900
A trader following this framework may prefer bullish FVGs in discount and bearish FVGs in premium.
However, this midpoint is a chart reference. It is not proof that EUR/USD is fundamentally cheap below 1.0900 or expensive above it.

Fair Value Gaps, Liquidity Sweeps, CHoCH and BOS
FVGs are often combined with liquidity and market-structure concepts. These terms require precise working definitions because different traders label them differently.
Liquidity in This Framework
On a standard retail chart, traders often infer potential concentrations of orders around:
- Equal highs
- Equal lows
- Swing highs
- Swing lows
- Previous-day highs and lows
- Session highs and lows
- Consolidation boundaries
These levels may attract stop-losses, breakout orders or profit-taking orders. The exact number of orders is generally not visible from candlesticks alone.
Liquidity Sweep
A liquidity sweep is a temporary move beyond a visible high or low followed by rejection or displacement in the opposite direction.
For example:
- Previous high: 1.0950
- Price spikes to 1.0958
- Price closes back below 1.0950
- Bearish displacement follows
This may be interpreted as a sweep. It is not automatically a bearish trade. Price could still recover and form a genuine breakout.
Break of Structure
For consistency, this article defines Break of Structure, or BOS, as a break in the direction of the established structural trend.
In an uptrend:
- Higher high
- Higher low
- Break above the prior significant high = bullish BOS
In a downtrend:
- Lower low
- Lower high
- Break below the prior significant low = bearish BOS
Change of Character
This article defines Change of Character, or CHoCH, as an initial structural break against the prevailing trend.
In an uptrend, a break below a significant higher low may be labeled bearish CHoCH. In a downtrend, a break above a significant lower high may be labeled bullish CHoCH.
A CHoCH is a warning that behavior may be changing. It is not confirmation that a complete reversal has begun.
CHoCH vs BOS
| Feature | CHoCH | BOS |
| Direction | Against the established trend | With the established trend |
| Typical use | Early transition warning | Continuation or structural confirmation |
| Reliability | Context-dependent and often early | Context-dependent and may occur late |
| Required level | Significant opposing swing | Significant continuation swing |
| Common mistake | Treating every minor break as a reversal | Entering after an overextended move |
| Guarantee | None | None |
Some traders use different terminology. A framework may call the first break in a new direction a BOS after a CHoCH, while another may call it a market-structure shift. The label matters less than having a consistent definition.
Why Traders Disagree About Structure
Suppose a chart contains:
- A major daily swing low
- A four-hour higher low
- Several five-minute internal lows
A five-minute break may be a bearish CHoCH on the execution chart while the daily market remains structurally bullish.
Disagreement can also result from:
- Wick versus closing-price breaks
- Internal versus external structure
- Different pivot lengths
- Different broker feeds
- Different analysis timeframes

How to Trade a Fair Value Gap Step by Step
The following process is an analytical framework, not a recommendation to enter a specific market.
1. Establish Higher-Timeframe Context
Select a timeframe that reflects the expected holding period.
An intraday trader might use:
- Four-hour chart for broad context
- One-hour chart for the active range
- Fifteen-minute chart for setup identification
- Five-minute chart for execution
A swing trader might use weekly, daily and four-hour charts instead.
2. Mark Relevant Liquidity and Structure
Identify:
- Major swing highs and lows
- Previous-day extremes
- Session ranges
- Equal highs or lows
- Higher-timeframe support and resistance
- Areas where breakout traders may enter
3. Wait for Displacement
Do not assume price will reverse merely because it touches liquidity. Wait for the price behavior required by the strategy, such as a strong close through a meaningful swing.
4. Mark the FVG
Record:
- Lower boundary
- Upper boundary
- Width in pips
- Midpoint
- Direction
- Timeframe
- Creation time
5. Select an Entry Model
| Entry model | Method | Advantage | Limitation |
| Nearest-edge entry | Enter when price first touches the FVG | Greater chance of receiving a fill | Less favorable price |
| Midpoint entry | Enter at 50% of the FVG | Balance between fill probability and price | Midpoint has no guaranteed significance |
| Far-edge entry | Enter near the deepest part of the zone | Better price and potentially smaller risk | More missed trades |
| Confirmation entry | Wait for rejection or lower-timeframe structure | Additional information before entry | Later price and sometimes wider stop |
6. Define Invalidation
The stop should reflect why the trade thesis would be wrong.
Possible rules include:
- Close beyond the liquidity-sweep extreme
- Close beyond the displacement origin
- Break of opposing market structure
- Full traversal and acceptance beyond the FVG
- Failure to retrace within a defined period
7. Choose a Target
Potential targets include:
- Previous swing high or low
- Previous-day high or low
- Opposing liquidity
- Opposing FVG
- Range boundary
- Fixed multiple of initial risk
8. Review Event Risk
Major releases can cause spreads and slippage to expand sharply. A strategy should specify whether positions may be opened or held around central-bank decisions, inflation data and labor-market reports.

Worked Fair Value Gap Trade Example
The following EUR/USD example is entirely hypothetical. The prices are designed to demonstrate calculations and are not live market quotations.
Trade Context
- Account balance: $10,000
- Risk per trade: 1%
- Maximum planned risk: $100
- Higher-timeframe context: Bullish
- Prior intraday low: Swept
- Execution-timeframe signal: Bullish CHoCH
- Bullish FVG: 1.0840–1.0852
- Entry: FVG midpoint at 1.0846
- Stop-loss: 1.0826
- Target: 1.0886
Stop Distance
Entry − stop:
1.0846 − 1.0826 = 0.0020
That equals 20 pips.
Target Distance
Target − entry:
1.0886 − 1.0846 = 0.0040
That equals 40 pips.
Gross Reward-to-Risk Ratio
40-pip target ÷ 20-pip stop = 2:1
Position Size
For this simplified EUR/USD example, assume one standard lot has an approximate pip value of $10 per pip in a US-dollar account.
Maximum risk per pip:
$100 ÷ 20 pips = $5 per pip
Position size:
$5 ÷ $10 = 0.50 standard lots
Therefore, the approximate position is 0.50 lots, or 50,000 units of the base currency.
Including Estimated Costs
Assume:
- Spread: 0.8 pip
- Round-turn commission equivalent: 0.7 pip
- Estimated total cost: 1.5 pips
At $5 per pip, estimated transaction cost is:
1.5 × $5 = $7.50
If the trader sizes solely for a $100 market loss, the total loss including estimated costs could be approximately $107.50.
To keep the complete planned loss closer to $100, deduct costs first:
$100 − $7.50 = $92.50 available for price risk
Adjusted pip risk:
$92.50 ÷ 20 = $4.625 per pip
Adjusted position size:
$4.625 ÷ $10 = 0.4625 lots
The practical order size could be rounded down to 0.46 lots, subject to the broker’s lot increments.
Possible Outcomes
| Outcome | What happens | Approximate result before variable slippage |
| Full target | Price reaches 1.0886 | About +$184 gross at 0.46 lots, less costs |
| Stop-loss | Price reaches 1.0826 | About −$92 gross, plus costs |
| Partial profit | Part closes before target | Depends on exit size and price |
| No retracement | Price never reaches 1.0846 | No trade and no market loss |
| Slippage during volatility | Fill differs from requested price | Outcome may be worse or better |
The trader should not chase the move simply because the entry was missed. “No trade” is a valid outcome.

Stop-Loss, Take-Profit and Expectancy
A narrow stop can improve the apparent reward-to-risk ratio, but only if it remains outside normal market noise and reflects genuine invalidation.
Stop Placement Comparison
| Stop location | Benefit | Risk |
| Just beyond the FVG | Small nominal stop | Normal volatility may stop the trade |
| Beyond displacement origin | Stronger structural logic | Larger stop and smaller position |
| Beyond sweep extreme | Directly tied to the reversal thesis | May be too wide for the available target |
| Volatility-based stop | Adjusts to changing conditions | May not align with market structure |
Fixed Target vs Market-Based Target
A fixed 2:1 target is easy to test, but the market does not know the trader’s risk multiple.
A market-based target may use a prior high, low or liquidity area. However, it can produce inconsistent reward-to-risk ratios.
One approach is to require both:
- A logical market target
- A minimum acceptable reward-to-risk ratio
If the market target offers only 0.8 times the amount risked, the setup may be rejected even when the FVG looks valid.
Why Reward-to-Risk Is Not Enough
Expectancy can be simplified as:
Expectancy = (Win rate × Average win) − (Loss rate × Average loss)
Strategy A
- Win rate: 35%
- Average win: 2R
- Loss rate: 65%
- Average loss: 1R
Expectancy:
(0.35 × 2) − (0.65 × 1)
= 0.70 − 0.65
= +0.05R per trade
Strategy B
- Win rate: 60%
- Average win: 1R
- Loss rate: 40%
- Average loss: 1R
Expectancy:
(0.60 × 1) − (0.40 × 1)
= +0.20R per trade
Although Strategy A has the larger reward-to-risk ratio, Strategy B has higher expectancy in these hypothetical examples.

Does Price Always Fill a Fair Value Gap?
No. Price does not always fill a Fair Value Gap.
Claims that every FVG must be filled are not suitable for a risk-managed trading framework. Price can produce several outcomes:
| Outcome | Definition |
| Full fill | Price reaches the opposite boundary of the FVG |
| Partial fill | Price enters the zone but does not reach its opposite boundary |
| Midpoint mitigation | Price reaches the 50% level but not the full zone |
| Front-run | Price reverses before touching the marked boundary |
| Full traversal | Price trades through the entire zone and continues |
| No revisit | Price moves away and does not return during the observation period |
“Filled” and “Mitigated” Are Not Universal Terms
One trader may call an FVG filled as soon as price touches its nearest boundary. Another may require the midpoint. A third may require price to reach the far boundary.
A backtest is meaningless unless the outcome is defined in advance.
For example:
- Touched: Any price enters the zone by at least 0.1 pip.
- Midpoint filled: Price reaches 50% of the zone.
- Fully filled: Price reaches the opposite edge.
- Closed: A candle closes beyond the opposite edge.
These outcomes should be recorded separately.
Why an FVG May Remain Unfilled
A zone may remain open because:
- Trend momentum persists
- New information changes market expectations
- Price establishes a new range
- The retracement is too shallow
- Higher-timeframe flows dominate
- The zone becomes irrelevant after substantial structural change
An old unfilled FVG is not automatically a future target. Its relevance may decline as volatility, fundamentals and market structure evolve.

When Is a Fair Value Gap Invalid?
There is no universal invalidation rule. Each strategy must define one before entry.
Full Trade-Through
If price moves entirely through a bullish FVG and closes decisively below it, the original bullish interpretation may be weakened.
However, some traders do not invalidate the idea until the displacement origin or sweep low fails. The chosen rule affects both the stop distance and backtest results.
Opposing Structure Break
A pending bullish setup may be cancelled if price produces bearish displacement and breaks a significant low before entering the bullish FVG.
Likewise, a bearish FVG may lose relevance if a bullish structural break occurs first.
Failure of the Displacement Origin
If price fully reverses the move that created the FVG, the original impulse may no longer control the market.
Repeated Testing
The first revisit is often treated differently from the fourth or fifth revisit. Repeated tests may indicate that orders around the area are being absorbed, although this interpretation must be tested rather than assumed.
Time-Based Expiry
An intraday trader may cancel an order at the end of the session. A swing trader may allow several days.
A clear rule could state:
Cancel any unfilled fifteen-minute FVG order at 17:00 New York time on the day it forms.
This prevents the trader from selectively keeping only the setups that later work.

What Is an Inverse Fair Value Gap?
An Inverse Fair Value Gap, or IFVG, is generally described as an FVG that fails and is later monitored from the opposite direction.
Bullish FVG Becomes Bearish
Suppose a bullish FVG extends from 1.0840 to 1.0852.
Price later:
- Trades through the entire zone
- Closes below 1.0840
- Retraces upward
- Encounters selling within the former bullish zone
Some traders relabel the failed bullish FVG as a bearish IFVG.
Bearish FVG Becomes Bullish
A bearish FVG may be treated as bullish after price closes above it and subsequently retests it from above.
The logic resembles a support-resistance polarity change, but the inversion is not automatic confirmation. A failed FVG can also lead to choppy trading without producing a clean reversal.
An IFVG setup should still require:
- Relevant market structure
- Clear invalidation
- Sufficient target space
- Acceptable costs
- A predefined entry model

Multi-Timeframe FVG Analysis
Timeframes should have distinct roles rather than being changed until a desired signal appears.
Example Workflow
| Timeframe | Purpose |
| Daily | Broad trend and major range |
| Four-hour | Higher-timeframe FVGs and key swings |
| Fifteen-minute | Setup and displacement |
| Five-minute | Entry refinement |
This hierarchy is illustrative. It is not universally superior.
Nested FVGs
A five-minute bullish FVG may form inside a four-hour bullish FVG.
This can provide a narrower execution area, but it also introduces extra conditions and can encourage overfitting. Test whether lower-timeframe refinement actually improves expectancy after costs.
Conflicting Timeframes
Assume:
- Daily structure is bullish
- Four-hour price is entering resistance
- One-hour structure is bearish
- Five-minute chart prints a bullish FVG
There is no objectively correct label for the complete market. The trader must decide which timeframe controls the setup.
Possible rules include:
- Trade only in the daily direction.
- Trade intraday countertrend setups but reduce risk.
- Require the one-hour structure to realign with the daily chart.
- Avoid the trade when the selected timeframes conflict.
Avoid Timeframe Hopping
Choose the analysis and execution timeframes before reviewing the setup. Moving from a failed five-minute chart to a one-minute chart to find a new CHoCH changes the strategy after the fact.

Common Fair Value Gap Trading Mistakes
| Mistake | Why it happens | Corrective action |
| Trading every FVG | Pattern recognition replaces context | Require displacement, structure, location and target space |
| Assuming every FVG must fill | Deterministic social-media explanations | Record full fills, partial fills and no revisits separately |
| Entering before Candle 3 confirms | Fear of missing the move | Wait until the three-candle structure exists |
| Ignoring spread and commission | Charts display idealized levels | Include all expected costs in testing and sizing |
| Using an extremely tight stop | Desire for a high reward-to-risk ratio | Place the stop at logical invalidation and reduce size |
| Confusing internal and external structure | Swing rules are undefined | Specify pivot and timeframe rules |
| Trading into major news | Event risk is underestimated | Use a documented news-event policy |
| Changing definitions after losses | Hindsight bias | Keep one written rule set for the entire sample |
| Assuming institutional intent | “Smart money” language sounds authoritative | Describe only what the chart objectively shows |
| Chasing a missed entry | Fear of missing continuation | Record it as an unfilled setup |
The CFTC warns that OTC Forex customers trade against their dealer rather than through an open centralized exchange and that fees, spreads and financing affect results. Its customer advisory reports that approximately two-thirds of customers at registered OTC Forex dealers lost money over the referenced one-year period after costs were considered.
That statistic is not an FVG failure rate. It is a broader warning that a chart pattern does not remove the structural risks of leveraged retail Forex trading.

How to Backtest an FVG Strategy
A useful backtest requires more than scrolling backward and marking examples that reacted perfectly.
1. Define the Pattern
Document:
- Bullish and bearish rules
- Wick-to-wick or body-to-body measurement
- Minimum gap size
- Displacement threshold
- Required structural event
- Permitted timeframes
- Permitted sessions
2. Define the Entry and Exit
Record:
- Nearest-edge, midpoint or confirmation entry
- Stop-loss rule
- Target method
- Partial-exit rule
- Break-even rule
- Maximum holding period
- Order expiry
3. Model Costs
Include:
- Historical spread
- Commission
- Slippage
- Overnight financing
- Different bid and ask execution where applicable
ESMA’s investor-protection material notes that leveraged CFD costs, including bid-ask spreads and financing, are based on the total exposure rather than only the margin deposited. It also emphasizes that leverage magnifies both profits and losses.
4. Avoid Look-Ahead Bias
At each simulated decision, use only information available at that time.
For example, do not label a minor high as “significant” merely because price later collapsed from it.
5. Track More Than Win Rate
A test journal should include:
| Field | Example |
| Date | 2026-03-12 |
| Pair | EUR/USD |
| Setup timeframe | 15 minutes |
| Direction | Bullish |
| FVG boundaries | 1.0840–1.0852 |
| FVG size | 12 pips |
| Structure event | Bullish CHoCH |
| Entry model | Midpoint |
| Stop distance | 20 pips |
| Target | Prior high |
| Estimated cost | 1.5 pips |
| Result | +1.8R net |
| Maximum adverse excursion | −0.4R |
| Maximum favorable excursion | +2.2R |
| Notes | First revisit after London displacement |
Also track:
- Full-fill rate
- Midpoint-fill rate
- No-revisit rate
- Average time to entry
- Average time in trade
- Consecutive losses
- Results by session
- Results by volatility regime
- Results around scheduled news
6. Use a Meaningful Sample
One hundred qualifying setups may provide an initial view, but it is not proof that the strategy has a durable edge. A stronger assessment requires different currency pairs, market conditions and out-of-sample data.
A strategy tested only during one strong trend may fail when volatility contracts or the market becomes range-bound.

Advantages and Limitations of FVG Trading
Potential Advantages
- The zone has objectively measurable boundaries.
- Entry, stop and target rules can be standardized.
- FVGs can be tested across pairs and timeframes.
- They provide a visual way to study rapid repricing.
- They can be combined with structure and liquidity frameworks.
- Missed trades can be handled through pending-order rules.
Important Limitations
- Market-structure labels remain partly subjective.
- Different broker feeds may display different gaps.
- An FVG does not prove institutional activity.
- Price is not required to revisit the zone.
- Lower-timeframe zones may be too small after costs.
- Historical charts make successful zones appear obvious.
- CHoCH and BOS definitions vary.
- Performance may change between trending and ranging markets.
- A pattern can be valid but offer poor trade economics.
The US dollar was on one side of 89.2% of global FX trades in April 2025, according to the BIS, while the euro accounted for 28.9% and the Japanese yen 16.8%. Currency shares total approximately 200% because every FX transaction contains two currencies.
This concentration makes major US-dollar pairs practical instruments for research, but it does not mean an FVG method will perform equally across EUR/USD, USD/JPY and less liquid crosses.
FVG Pre-Trade Checklist
Context
- What is the selected higher-timeframe structure?
- Is price trending, ranging or transitioning?
- Where is the nearest significant swing?
- Did price sweep an identifiable high or low?
- Is the FVG near a meaningful range boundary?
Pattern
- Is there genuine wick-to-wick non-overlap?
- Has Candle 3 closed?
- Is Candle 2 meaningful relative to recent candles?
- Did displacement break relevant structure?
- Is this the first revisit?
Risk
- What specific event invalidates the trade?
- How many pips separate entry and stop?
- How much money will be lost if stopped?
- Are spread, commission and slippage included?
- Is the target based on actual structure?
- Is the net reward-to-risk ratio acceptable?
- Is a major economic release approaching?
Execution
- Which entry model applies?
- When does the pending order expire?
- Are partial exits allowed?
- Can the stop be moved?
- What happens if price never retraces?
- Is the trade still valid if the spread widens?

Recommended Internal Links
Placement 1: Market-Structure Section
- Related topic: Break of Structure and Change of Character
- Suggested anchor text: CHoCH and BOS in Forex trading
- URL:
[INSERT URL]
Recommended placement: After the CHoCH vs BOS comparison table.
Placement 2: Liquidity Section
- Related topic: Liquidity sweeps and stop hunts
- Suggested anchor text: how liquidity sweeps work in Forex
- URL:
[INSERT URL]
Recommended placement: After the liquidity-sweep example.
Placement 3: Worked Example
- Related topic: Forex position sizing
- Suggested anchor text: calculate Forex position size
- URL:
[INSERT URL]
Recommended placement: Immediately before the position-size formula.
Placement 4: Risk-Management Section
- Related topic: Risk-to-reward ratio
- Suggested anchor text: risk-to-reward ratio explained
- URL:
[INSERT URL]
Recommended placement: Before the expectancy examples.
Placement 5: Backtesting Section
- Related topic: Strategy testing
- Suggested anchor text: how to backtest a Forex strategy
- URL:
[INSERT URL]
Recommended placement: At the beginning of the backtesting section.
Frequently Asked Questions
What is a Fair Value Gap in Forex?
A Fair Value Gap is a three-candle price structure in which Candle 1 and Candle 3 do not overlap across part of Candle 2’s range. A bullish FVG exists when Candle 3’s low is above Candle 1’s high. A bearish FVG exists when Candle 3’s high is below Candle 1’s low.
What is the difference between an FVG and an imbalance?
An FVG is a specifically defined three-candle chart pattern. Imbalance is a broader term that may refer to rapid one-sided price movement or, when appropriate data are available, an uneven distribution of bids, offers or executed volume. A candlestick FVG is not direct order-flow data.
Does price always return to fill an FVG?
No. Price may fully fill the zone, reach only its midpoint, enter it partially, reverse before touching it, trade straight through it or never revisit it. Any strategy based on FVG fills should measure each outcome with predefined rules.
Which timeframe is best for Fair Value Gaps?
There is no universally best timeframe. Higher timeframes generally produce fewer, wider zones, while lower timeframes produce more signals that are more sensitive to spread, feed differences and short-term noise. The best timeframe is the one that fits the holding period and has demonstrated acceptable results in testing.
What invalidates a Fair Value Gap?
Invalidation depends on the strategy. Possible rules include a close through the opposite side of the FVG, failure of the displacement origin, a break of opposing structure, failure of the liquidity-sweep extreme or expiration after a fixed period.
Conclusion: Use FVGs as Context, Not Certainty
A Fair Value Gap is a clearly defined way to map rapid three-candle price movement. It can help traders organize entries, invalidation and targets, but it is not evidence that price must rebalance or that institutional traders will defend a particular level.
The strongest FVG analysis considers displacement, market structure, liquidity context, timeframe alignment, transaction costs and position sizing together. CHoCH may warn of a transition, while BOS may support a continuation framework, but neither guarantees the next move.
Before risking capital, define one precise FVG model and test it on historical and simulated data. Record every qualifying setup—including failed zones, partial fills, missed entries and trading costs—rather than studying only successful chart examples.
Financial Risk Disclaimer
This article is provided for educational and informational purposes only. It does not constitute investment advice, trading advice, a recommendation, an offer or a solicitation to buy or sell currencies, CFDs, derivatives or any other financial instrument.
Forex and CFD trading involve substantial risk. Leverage can magnify both profits and losses, and losses may occur rapidly. ESMA’s retail CFD framework includes leverage limits of 30:1 for major currency pairs and 20:1 for non-major currency pairs, but these limits apply within a specific European regulatory context and are not universal. Readers should verify the rules, protections and broker requirements applicable in their jurisdiction as of 2026.
Past performance, historical chart patterns and backtesting results do not guarantee future performance. Hypothetical results may differ materially from live execution because of spreads, commissions, slippage, latency, financing costs and changing market conditions.
Only trade with capital you can afford to lose. Consider your financial circumstances, experience and risk tolerance, and seek independent professional advice where appropriate. Verify the registration and disciplinary history of any broker or dealer with the relevant regulator before depositing funds. The CFTC specifically advises customers to investigate OTC Forex dealers before providing money or personal information.